Money·Data May 2025, Employment 2025, projected 2035
Which jobs pay the most in the U.S.?
Doctors fill the top of the list, but there is more to see below them. Rank all 830 occupations the Bureau of Labor Statistics measures by median or mean pay, narrow them to the jobs you could enter with the education you have, open any one to see the spread of pay inside it and its outlook, and compare your own pay, which never leaves your browser.
- May 2025, Employment 2025, projected 2035Released May 15, 2026 by U.S. Bureau of Labor Statistics
All occupations: highest median pay
Showing 20 of 830 occupations, highest first. Dot color shows the typical education.
Each row is one occupation: the dot is its median annual wage, the thin line runs from the 10th to the 90th percentile, the shaded band holds the middle half of workers, and the small tick marks the mean. The dashed line is the median for all workers. Point at or tap a row to see its numbers; click or tap it again to open its close-up. With a keyboard, focus the chart and use the arrow keys, Enter to open, Escape to clear.
Close-up
Registered Nurses
Registered Nurses: half earn between $80,330 and $112,350 a year.
The median is $97,550 ($46.90 an hour) and the mean $101,420. One in ten earns less than $68,940, and one in ten more than $137,470.
Your pay stays in this browser: it is not stored, put in links, or sent anywhere.
Enter an annual amount to see how many occupations' typical worker earns more, and where it falls among all U.S. wage and salary workers and among registered nurses. For comparison, the median for all workers is $50,980 and the mean $69,770.
These are national wages for wage and salary workers in May 2025, before taxes and without overtime, most bonuses or benefits; they exclude the self-employed. Your own pay depends on place, industry, experience and hours, so treat a comparison as context, not a verdict.
The top row is the chosen occupation, the bottom row all occupations together. Each box holds the middle half of workers (25th to 75th percentile), the thick tick is the median, the diamond the mean, and the whiskers reach the 10th and 90th percentiles. Point at or tap a mark, or focus the chart and use the arrow keys, to read its value.
- Healthcare practitioners and technicians
- Bachelor's degree
- None
- None
- 3.4 million
- +5.6% (all jobs +3.5%)
- 180,800
- 0.5%
- 29-1141
Every occupation, by the education it typically needs
All 825 occupations with an annual wage, placed by median annual wage on a log scale (each step right doubles pay). The dashed line is the median for all workers, $50,980.
Each dot is one occupation, in the row of the education BLS considers typical to enter it. Point at or tap a dot to see the occupation; click or tap it to open its close-up above. With a keyboard, focus the chart and use the arrow keys to step from the lowest-paid occupation to the highest, Enter to open, Escape to clear.
5 occupations paid only by the hour (such as actors and musicians) have no annual wage and are not shown here; they are in the ranking and the table.
01
Key findings
- 01
Medicine owns the top of the list: All of the 20 highest median wages belong to healthcare practitioners, led by pediatric surgeons at $559,030 a year. The first occupation outside health care, at number 21, is airline pilots, copilots, and flight engineers ($232,140), followed by chief executives ($213,990).
- 02
Six figures is rare: 138 of 825 occupations (17%) have a median of $100,000 or more, and together they hold 15% of the nation's 155.5 million wage and salary jobs. Half of all workers earn less than $50,980.
- 03
Education raises the odds, not the certainty: 58% of occupations that typically need a doctoral or professional degree have a median of $100,000 or more, against 2% of those that need no degree. Still, 13 occupations below a bachelor's clear that mark, led by air traffic controllers ($148,080, an associate's degree) and commercial pilots ($123,220).
- 04
The average flatters: in 772 of 825 occupations the mean wage is above the median, because a minority of high earners pull it up. Across all workers the mean is $69,770 and the median $50,980; for athletes and sports competitors the gap is $139,470.
- 05
Most of the biggest jobs pay below the middle: 8 of the 10 largest occupations have a median below $50,980, led by home health and personal care aides (4.3 million jobs, $35,800). The lowest median of all, $30,890, belongs to cooks, fast food, 18 times less than the highest.
02
Analysis
Medicine fills the top of the list
Rank every occupation the Bureau of Labor Statistics measures by its median annual wage, the pay of the worker in the middle, and the top is not close. All of the 20 highest-paid occupations are healthcare practitioners, almost all of them physicians, surgeons and dentists. Pediatric Surgeons lead at $559,030 a year, followed by cardiologists ($496,010), radiologists ($420,860) and anesthesiologists ($391,490). Even the 20th occupation on the list has a median of $236,590.
The first job outside health care appears at number 21: airline pilots, copilots, and flight engineers, at $232,140. Then come chief executives ($213,990), industrial-organizational psychologists ($193,950, a small occupation of 790 jobs) and computer and information systems managers ($175,140).
These rankings are new in one respect. Before the May 2025 estimates, BLS printed any wage of $239,200 or more only as "$239,200 or more", so most physician medians could not be compared with one another. Beginning with the May 2025 estimates, BLS publishes many of those values exactly, which is why the order among doctors is visible here. It also means the top of this list cannot be compared directly with older rankings.
A six-figure median is rare
Of the 825 occupations with an annual wage, 138 (17%) have a median of $100,000 or more, and only 24 clear $200,000. The six-figure occupations hold 23.3 million jobs, 15% of the nation's 155.5 million wage and salary jobs.
Across all workers, the median is $50,980: half of wage and salary workers are paid less. One in ten earns less than $31,200 and one in ten more than $128,560. 295 occupations have a median below that national middle.
Most of the jobs people do pay below the middle
Size and pay run in opposite directions. 8 of the 10 largest occupations, which together hold 21% of all jobs, have a median below $50,980. The largest, home health and personal care aides, has 4.3 million jobs and a median of $35,800; retail salespersons ($35,410) and fast food and counter workers ($31,200) follow. The exceptions among the ten are general and operations managers ($105,770) and registered nurses ($97,550).
The lowest median of all belongs to cooks, fast food, $30,890, followed by hosts and hostesses, restaurant, lounge, and coffee shop ($31,200) and fast food and counter workers ($31,200). The highest median is 18 times the lowest. Switch the ranking to Lowest paid to see the full bottom of the list.
Education raises the odds, not the certainty
BLS assigns each occupation the education typically needed to enter it. The more education a job requires, the more likely it is to pay well: 58% of occupations that typically need a doctoral or professional degree have a median of $100,000 or more, as do 43% of those needing a master's and 37% of those needing a bachelor's, but only 8% needing an associate's and 2% needing no degree. The middle occupation in each group shows the same ladder, from $49,030 with no degree to $103,410 with a doctorate.
The dot chart below the close-up shows how much the groups overlap. 13 occupations that need less than a bachelor's degree have a median of $100,000 or more. Air Traffic Controllers need an associate's degree and have a median of $148,080. Among jobs that need no degree, commercial pilots ($123,220), nuclear power reactor operators ($122,890) and elevator and escalator installers and repairers ($109,910) lead. Many of these require something else instead: a license, years of related experience, or a long apprenticeship. The close-up lists the experience and training BLS considers typical for each.
The groups also differ in size. Occupations that typically need no degree hold 68% of all wage and salary jobs; those needing a bachelor's, 25%.
Mean or median?
The ranking can use either. The median is the pay of the worker in the middle; the mean is total pay divided by the number of workers. In 772 of 825 occupations the mean is higher, because pay is lopsided: a minority of high earners pulls the average up while the middle stays put. Across all workers the mean is $69,770, $18,790 above the median. The widest gap is for athletes and sports competitors, whose mean ($206,180) is $139,470 above the median ($66,710). When you want to know what a typical worker earns, the median is the better guide.
The spread inside one job
A single number hides a wide range. Open any occupation in the close-up to see its 10th to 90th percentiles. For registered nurses, the default example, half earn between $80,330 and $112,350, and the 90th percentile ($137,470) is 2.0 times the 10th ($68,940). Across all workers the same ratio is 4.1 times. Place, industry, experience, specialty and hours explain much of the spread, and none of them is in a national average.
Where you fit
Type an annual amount into the close-up and every view answers: how many occupations' typical worker earns more, where the amount falls among all U.S. wage and salary workers, and where it falls inside the occupation you chose. The comparison runs in your browser and the amount is never stored or sent. It compares your pay with national figures from May 2025; it cannot say what you would earn in another job, in another place, or with more experience.
What the data cannot tell you
These are survey estimates of what employers pay their employees, averaged across every industry and state. They exclude the self-employed, which matters for occupations such as physicians, lawyers and real estate agents, where many work for themselves. Wages leave out overtime, nonproduction bonuses, stock and benefits. Small occupations have wider margins of error. Projections of future jobs are BLS's best estimates, not guarantees.
03
The data
About all 830 occupations, May 2025. These are the values behind the chart and findings. Observation period: May 2025, Employment 2025, projected 2035.
| Rank | Occupation | Job family | Typical education to enter | Jobs | Median annual wage | Mean annual wage | 10th percentile | 90th percentile | Median hourly wage ($) | Projected change 2025–35 |
|---|---|---|---|---|---|---|---|---|---|---|
| 1 | Pediatric Surgeons | Healthcare practitioners and technicians | Doctoral or professional degree | 1,190 | $559,030 | $502,050 | $215,410 | $726,660 | 268.76 | +2.0% |
| 2 | Cardiologists | Healthcare practitioners and technicians | Doctoral or professional degree | 17,290 | $496,010 | $454,940 | $107,190 | $712,130 | 238.47 | +4.8% |
| 3 | Radiologists | Healthcare practitioners and technicians | Doctoral or professional degree | 26,770 | $420,860 | $381,530 | $89,010 | $594,410 | 202.34 | +3.4% |
| 4 | Surgeons, All Other | Healthcare practitioners and technicians | Doctoral or professional degree | 25,140 | $414,010 | $373,930 | $80,320 | $655,320 | 199.04 | +4.0% |
| 5 | Anesthesiologists | Healthcare practitioners and technicians | Doctoral or professional degree | 38,760 | $391,490 | $360,570 | $101,460 | $557,130 | 188.22 | +3.6% |
| 6 | Orthopedic Surgeons, Except Pediatric | Healthcare practitioners and technicians | Doctoral or professional degree | 14,100 | $358,550 | $373,570 | $84,170 | $659,290 | 172.38 | +4.0% |
| 7 | Oral and Maxillofacial Surgeons | Healthcare practitioners and technicians | Doctoral or professional degree | 4,910 | $352,220 | $346,490 | $86,250 | $622,640 | 169.34 | +5.6% |
| 8 | Emergency Medicine Physicians | Healthcare practitioners and technicians | Doctoral or professional degree | 32,880 | $335,550 | $317,480 | $103,610 | $495,910 | 161.32 | +3.2% |
| 9 | Dermatologists | Healthcare practitioners and technicians | Doctoral or professional degree | 11,370 | $328,730 | $323,530 | $102,810 | $578,560 | 158.04 | +6.8% |
| 10 | Physicians, Pathologists | Healthcare practitioners and technicians | Doctoral or professional degree | 11,110 | $312,400 | $285,420 | $92,540 | $449,970 | 150.19 | +4.8% |
| 11 | Prosthodontists | Healthcare practitioners and technicians | Doctoral or professional degree | 870 | $311,180 | $268,630 | $103,510 | $344,750 | 149.61 | +5.8% |
| 12 | Ophthalmologists, Except Pediatric | Healthcare practitioners and technicians | Doctoral or professional degree | 8,950 | $300,080 | $304,650 | $100,180 | $489,710 | 144.27 | +4.5% |
| 13 | Obstetricians and Gynecologists | Healthcare practitioners and technicians | Doctoral or professional degree | 21,260 | $292,910 | $279,040 | $94,680 | $437,300 | 140.82 | +1.7% |
| 14 | Orthodontists | Healthcare practitioners and technicians | Doctoral or professional degree | 6,210 | $289,140 | $259,400 | $99,850 | $416,000 | 139.01 | +6.0% |
| 15 | Psychiatrists | Healthcare practitioners and technicians | Doctoral or professional degree | 27,980 | $281,870 | $269,940 | $84,060 | $446,520 | 135.51 | +7.2% |
| 16 | Physicians, All Other | Healthcare practitioners and technicians | Doctoral or professional degree | 342,720 | $265,930 | $262,040 | $69,170 | $452,360 | 127.85 | +3.4% |
| 17 | General Internal Medicine Physicians | Healthcare practitioners and technicians | Doctoral or professional degree | 67,150 | $256,560 | $267,200 | $73,570 | $475,430 | 123.35 | +4.0% |
| 18 | Neurologists | Healthcare practitioners and technicians | Doctoral or professional degree | 10,590 | $248,560 | $267,630 | $83,370 | $450,780 | 119.50 | +6.4% |
| 19 | Family Medicine Physicians | Healthcare practitioners and technicians | Doctoral or professional degree | 107,510 | $244,180 | $255,820 | $76,830 | $428,550 | 117.39 | +3.3% |
| 20 | Nurse Anesthetists | Healthcare practitioners and technicians | Master's degree | 51,840 | $236,590 | $248,320 | $155,250 | $339,500 | 113.75 | +9.7% |
| 21 | Airline Pilots, Copilots, and Flight Engineers | Transportation and material moving | Bachelor's degree | 103,560 | $232,140 | $288,650 | $106,710 | $463,830 | Not available | +8.3% |
| 22 | Dentists, All Other Specialists | Healthcare practitioners and technicians | Doctoral or professional degree | 5,230 | $224,990 | $247,930 | $104,120 | $402,700 | 108.17 | +1.3% |
| 23 | Chief Executives | Management | Bachelor's degree | 204,350 | $213,990 | $269,630 | $75,700 | $507,730 | 102.88 | +3.2% |
| 24 | Pediatricians, General | Healthcare practitioners and technicians | Doctoral or professional degree | 39,390 | $210,040 | $212,110 | $91,470 | $338,500 | 100.98 | +1.5% |
| 25 | Industrial-Organizational Psychologists | Life, physical and social science | Master's degree | 790 | $193,950 | $170,230 | $79,010 | $247,220 | 93.24 | +6.5% |
| 26 | Computer and Information Systems Managers | Management | Bachelor's degree | 670,570 | $175,140 | $192,160 | $107,550 | $297,510 | 84.20 | +15.8% |
| 27 | Physicists | Life, physical and social science | Doctoral or professional degree | 20,430 | $172,250 | $171,180 | $82,110 | $274,110 | 82.81 | +7.2% |
| 28 | Architectural and Engineering Managers | Management | Bachelor's degree | 220,260 | $171,270 | $181,540 | $120,810 | $262,760 | 82.34 | +5.5% |
| 29 | Dentists, General | Healthcare practitioners and technicians | Doctoral or professional degree | 124,390 | $170,950 | $191,350 | $86,250 | $319,630 | 82.19 | +5.7% |
| 30 | Natural Sciences Managers | Management | Bachelor's degree | 108,690 | $167,220 | $180,250 | $79,710 | $316,850 | 80.39 | +8.2% |
| 31 | Marketing Managers | Management | Bachelor's degree | 395,240 | $166,790 | $177,770 | $90,260 | $293,610 | 80.19 | +6.9% |
| 32 | Financial Managers | Management | Bachelor's degree | 841,710 | $166,570 | $186,910 | $94,310 | $323,270 | 80.08 | +9.7% |
| 33 | Computer Hardware Engineers | Architecture and engineering | Bachelor's degree | 76,660 | $161,740 | $162,670 | $92,940 | $225,330 | 77.76 | +9.1% |
| 34 | Podiatrists | Healthcare practitioners and technicians | Doctoral or professional degree | 9,680 | $160,300 | $175,480 | $66,010 | $309,670 | 77.07 | +2.0% |
| 35 | Lawyers | Legal | Doctoral or professional degree | 754,500 | $159,670 | $185,840 | $78,360 | $351,600 | 76.76 | +4.7% |
| 36 | Judges, Magistrate Judges, and Magistrates | Legal | Doctoral or professional degree | 24,030 | $153,990 | $143,830 | $46,950 | $221,710 | 74.03 | +2.8% |
| 37 | Human Resources Managers | Management | Bachelor's degree | 220,660 | $149,280 | $164,230 | $88,200 | $267,810 | 71.77 | +5.5% |
| 38 | Compensation and Benefits Managers | Management | Bachelor's degree | 22,940 | $149,230 | $162,640 | $89,160 | $256,570 | 71.75 | +1.1% |
| 39 | Sales Managers | Management | Bachelor's degree | 637,080 | $148,270 | $164,350 | $73,170 | $290,540 | 71.28 | +4.5% |
| 40 | Air Traffic Controllers | Transportation and material moving | Associate's degree | 22,510 | $148,080 | $146,490 | $78,420 | $215,610 | 71.19 | +1.7% |
| 41 | Purchasing Managers | Management | Bachelor's degree | 84,320 | $148,080 | $156,360 | $92,490 | $223,280 | 71.19 | +4.0% |
| 42 | Medical Dosimetrists | Healthcare practitioners and technicians | Bachelor's degree | 3,410 | $147,470 | $148,500 | $111,670 | $185,450 | 70.90 | +5.0% |
| 43 | Public Relations Managers | Management | Bachelor's degree | 74,850 | $146,910 | $164,760 | $82,410 | $284,990 | 70.63 | +5.7% |
| 44 | Petroleum Engineers | Architecture and engineering | Bachelor's degree | 18,060 | $144,910 | $157,150 | $81,440 | $253,200 | 69.67 | +2.0% |
| 45 | Political Scientists | Life, physical and social science | Master's degree | 5,540 | $142,080 | $142,510 | $83,350 | $195,190 | 68.31 | −2.0% |
| 46 | Managers, All Other | Management | Bachelor's degree | 622,190 | $141,900 | $153,890 | $74,300 | $238,270 | 68.22 | +4.9% |
| 47 | Pharmacists | Healthcare practitioners and technicians | Doctoral or professional degree | 321,970 | $140,910 | $140,920 | $99,290 | $174,230 | 67.75 | +5.2% |
| 48 | Computer and Information Research Scientists | Computer and math | Master's degree | 37,200 | $140,300 | $153,930 | $82,200 | $230,630 | 67.45 | +21.8% |
| 49 | Database Architects | Computer and math | Bachelor's degree | 67,140 | $139,500 | $144,440 | $86,240 | $204,000 | 67.07 | +9.4% |
| 50 | Optometrists | Healthcare practitioners and technicians | Doctoral or professional degree | 42,790 | $136,570 | $141,550 | $74,870 | $202,180 | 65.66 | +9.5% |
| 51 | Software Developers | Computer and math | Bachelor's degree | 1,687,890 | $135,980 | $148,100 | $82,460 | $214,670 | 65.38 | +10.2% |
| 52 | Physician Assistants | Healthcare practitioners and technicians | Master's degree | 162,150 | $135,880 | $141,280 | $99,380 | $190,280 | 65.33 | +21.1% |
| 53 | Aerospace Engineers | Architecture and engineering | Bachelor's degree | 67,710 | $134,960 | $142,060 | $86,700 | $205,890 | 64.89 | +8.3% |
| 54 | Computer Network Architects | Computer and math | Bachelor's degree | 179,740 | $134,050 | $139,580 | $79,900 | $202,680 | 64.45 | +7.7% |
| 55 | Nurse Midwives | Healthcare practitioners and technicians | Master's degree | 7,920 | $134,040 | $136,980 | $93,620 | $188,320 | 64.44 | +11.5% |
| 56 | Nuclear Engineers | Architecture and engineering | Bachelor's degree | 15,280 | $133,970 | $140,420 | $92,960 | $196,290 | 64.41 | +0.4% |
| 57 | Advertising and Promotions Managers | Management | Bachelor's degree | 21,470 | $133,660 | $154,280 | $63,300 | $286,240 | 64.26 | −3.7% |
| 58 | Training and Development Managers | Management | Bachelor's degree | 48,050 | $133,000 | $148,370 | $79,550 | $233,600 | 63.94 | +6.4% |
| 59 | Nurse Practitioners | Healthcare practitioners and technicians | Master's degree | 323,040 | $132,300 | $137,300 | $101,340 | $174,420 | 63.61 | +41.0% |
| 60 | Electronics Engineers, Except Computer | Architecture and engineering | Bachelor's degree | 96,900 | $130,220 | $137,280 | $81,840 | $206,960 | 62.60 | +3.7% |
| 61 | Veterinarians | Healthcare practitioners and technicians | Doctoral or professional degree | 83,900 | $130,100 | $142,680 | $73,920 | $215,700 | 62.55 | +9.4% |
| 62 | Actuaries | Computer and math | Bachelor's degree | 26,670 | $130,000 | $141,480 | $78,570 | $215,100 | 62.50 | +9.2% |
| 63 | Information Security Analysts | Computer and math | Bachelor's degree | 190,650 | $129,180 | $132,510 | $75,090 | $199,850 | 62.11 | +21.0% |
| 64 | Astronomers | Life, physical and social science | Doctoral or professional degree | 2,120 | $128,820 | $132,920 | $78,010 | $195,190 | 61.94 | +7.8% |
| 65 | Law Teachers, Postsecondary | Education and library | Doctoral or professional degree | 20,060 | $128,500 | $144,770 | $64,250 | $287,900 | Not available | +2.6% |
| 66 | Biochemists and Biophysicists | Life, physical and social science | Doctoral or professional degree | 33,830 | $127,410 | $129,840 | $74,290 | $201,110 | 61.26 | +12.3% |
| 67 | Mathematicians | Computer and math | Master's degree | 2,030 | $126,710 | $129,260 | $69,240 | $195,190 | 60.92 | +0.6% |
| 68 | Industrial Production Managers | Management | Bachelor's degree | 246,250 | $126,060 | $134,170 | $78,000 | $205,520 | 60.61 | +2.6% |
| 69 | Fundraising Managers | Management | Bachelor's degree | 38,810 | $125,470 | $140,020 | $75,130 | $222,350 | 60.32 | +5.4% |
| 70 | Chemical Engineers | Architecture and engineering | Bachelor's degree | 21,070 | $125,040 | $129,980 | $79,420 | $182,880 | 60.12 | +4.7% |
| 71 | Sales Engineers | Sales | Bachelor's degree | 51,790 | $124,900 | $130,140 | $73,870 | $195,270 | 60.05 | +2.8% |
| 72 | Economists | Life, physical and social science | Master's degree | 17,790 | $124,720 | $142,130 | $67,360 | $238,060 | 59.96 | +4.7% |
| 73 | Economics Teachers, Postsecondary | Education and library | Doctoral or professional degree | 11,560 | $123,920 | $138,850 | $64,060 | $224,200 | Not available | +2.4% |
| 74 | Medical and Health Services Managers | Management | Bachelor's degree | 597,080 | $123,860 | $140,970 | $73,390 | $224,340 | 59.55 | +24.2% |
| 75 | Commercial Pilots | Transportation and material moving | Postsecondary nondegree award | 47,630 | $123,220 | $146,080 | $58,850 | $266,620 | Not available | +5.2% |
| 76 | Engineers, All Other | Architecture and engineering | Bachelor's degree | 154,070 | $122,930 | $125,330 | $66,810 | $189,950 | 59.10 | +3.7% |
| 77 | Nuclear Power Reactor Operators | Production | High school diploma or equivalent | 5,150 | $122,890 | $121,380 | $98,640 | $149,310 | 59.08 | −5.9% |
| 78 | Physical Scientists, All Other | Life, physical and social science | Bachelor's degree | 22,300 | $122,570 | $129,230 | $67,000 | $195,190 | 58.93 | +2.1% |
| 79 | Electrical Engineers | Architecture and engineering | Bachelor's degree | 198,750 | $120,630 | $125,100 | $76,550 | $184,300 | 58.00 | +9.9% |
| 80 | Data Scientists | Computer and math | Bachelor's degree | 262,440 | $120,230 | $126,800 | $67,240 | $199,130 | 57.80 | +34.6% |
| 81 | Administrative Law Judges, Adjudicators, and Hearing Officers | Legal | Doctoral or professional degree | 16,370 | $117,860 | $125,990 | $61,110 | $207,480 | 56.67 | 0.0% |
| 82 | Materials Scientists | Life, physical and social science | Bachelor's degree | 8,470 | $117,790 | $126,180 | $66,820 | $197,290 | 56.63 | +8.3% |
| 83 | Financial Risk Specialists | Business and finance | Bachelor's degree | 63,850 | $117,330 | $124,420 | $64,820 | $196,110 | 56.41 | +7.4% |
| 84 | Computer Occupations, All Other | Computer and math | Bachelor's degree | 435,370 | $116,580 | $122,230 | $55,940 | $188,470 | 56.05 | +5.1% |
| 85 | Healthcare Diagnosing or Treating Practitioners, All Other | Healthcare practitioners and technicians | Master's degree | 28,630 | $115,210 | $127,660 | $65,210 | $195,190 | 55.39 | +5.5% |
| 86 | Health and Safety Engineers, Except Mining Safety Engineers and Inspectors | Architecture and engineering | Bachelor's degree | 21,450 | $115,160 | $119,770 | $68,420 | $171,250 | 55.36 | +5.4% |
| 87 | Construction Managers | Management | Bachelor's degree | 380,360 | $114,990 | $124,360 | $69,690 | $189,440 | 55.28 | +9.1% |
| 88 | Art Directors | Arts, design, entertainment, sports and media | Bachelor's degree | 53,070 | $114,850 | $129,440 | $64,900 | $213,050 | 55.22 | +4.2% |
| 89 | Administrative Services Managers | Management | Bachelor's degree | 263,960 | $114,130 | $129,870 | $67,100 | $207,720 | 54.87 | +5.2% |
| 90 | Materials Engineers | Architecture and engineering | Bachelor's degree | 22,770 | $112,860 | $120,250 | $72,300 | $175,720 | 54.26 | +7.5% |
| 91 | Marine Engineers and Naval Architects | Architecture and engineering | Bachelor's degree | 8,250 | $112,230 | $124,180 | $83,010 | $173,330 | 53.96 | +6.7% |
| 92 | Psychologists, All Other | Life, physical and social science | Master's degree | 18,820 | $110,840 | $111,210 | $54,990 | $168,520 | 53.29 | +2.3% |
| 93 | Nuclear Technicians | Life, physical and social science | Associate's degree | 6,470 | $110,240 | $108,940 | $73,150 | $133,600 | 53.00 | +1.1% |
| 94 | Elevator and Escalator Installers and Repairers | Construction and extraction | High school diploma or equivalent | 23,790 | $109,910 | $109,820 | $59,270 | $158,890 | 52.84 | +5.7% |
| 95 | Ship Engineers | Transportation and material moving | Postsecondary nondegree award | 8,400 | $109,530 | $111,790 | $57,870 | $165,490 | 52.66 | +2.7% |
| 96 | Bioengineers and Biomedical Engineers | Architecture and engineering | Bachelor's degree | 23,480 | $109,370 | $116,890 | $71,850 | $168,180 | 52.58 | +7.6% |
| 97 | Engineering Teachers, Postsecondary | Education and library | Doctoral or professional degree | 40,270 | $109,270 | $124,520 | $61,550 | $210,370 | Not available | +7.8% |
| 98 | Health Specialties Teachers, Postsecondary | Education and library | Doctoral or professional degree | 221,270 | $107,310 | $147,570 | $59,270 | $322,020 | Not available | +17.9% |
| 99 | Transportation, Storage, and Distribution Managers | Management | High school diploma or equivalent | 221,180 | $107,230 | $121,600 | $65,120 | $194,900 | 51.55 | +6.1% |
| 100 | Environmental Engineers | Architecture and engineering | Bachelor's degree | 38,340 | $107,110 | $112,910 | $69,990 | $162,220 | 51.50 | +6.3% |
Download the full table as CSV (178 KB). Source: U.S. Bureau of Labor Statistics, Occupational Employment and Wage Statistics (May 2025) and Employment Projections (2025–35). Analysis: World Made Visual.
Free downloads
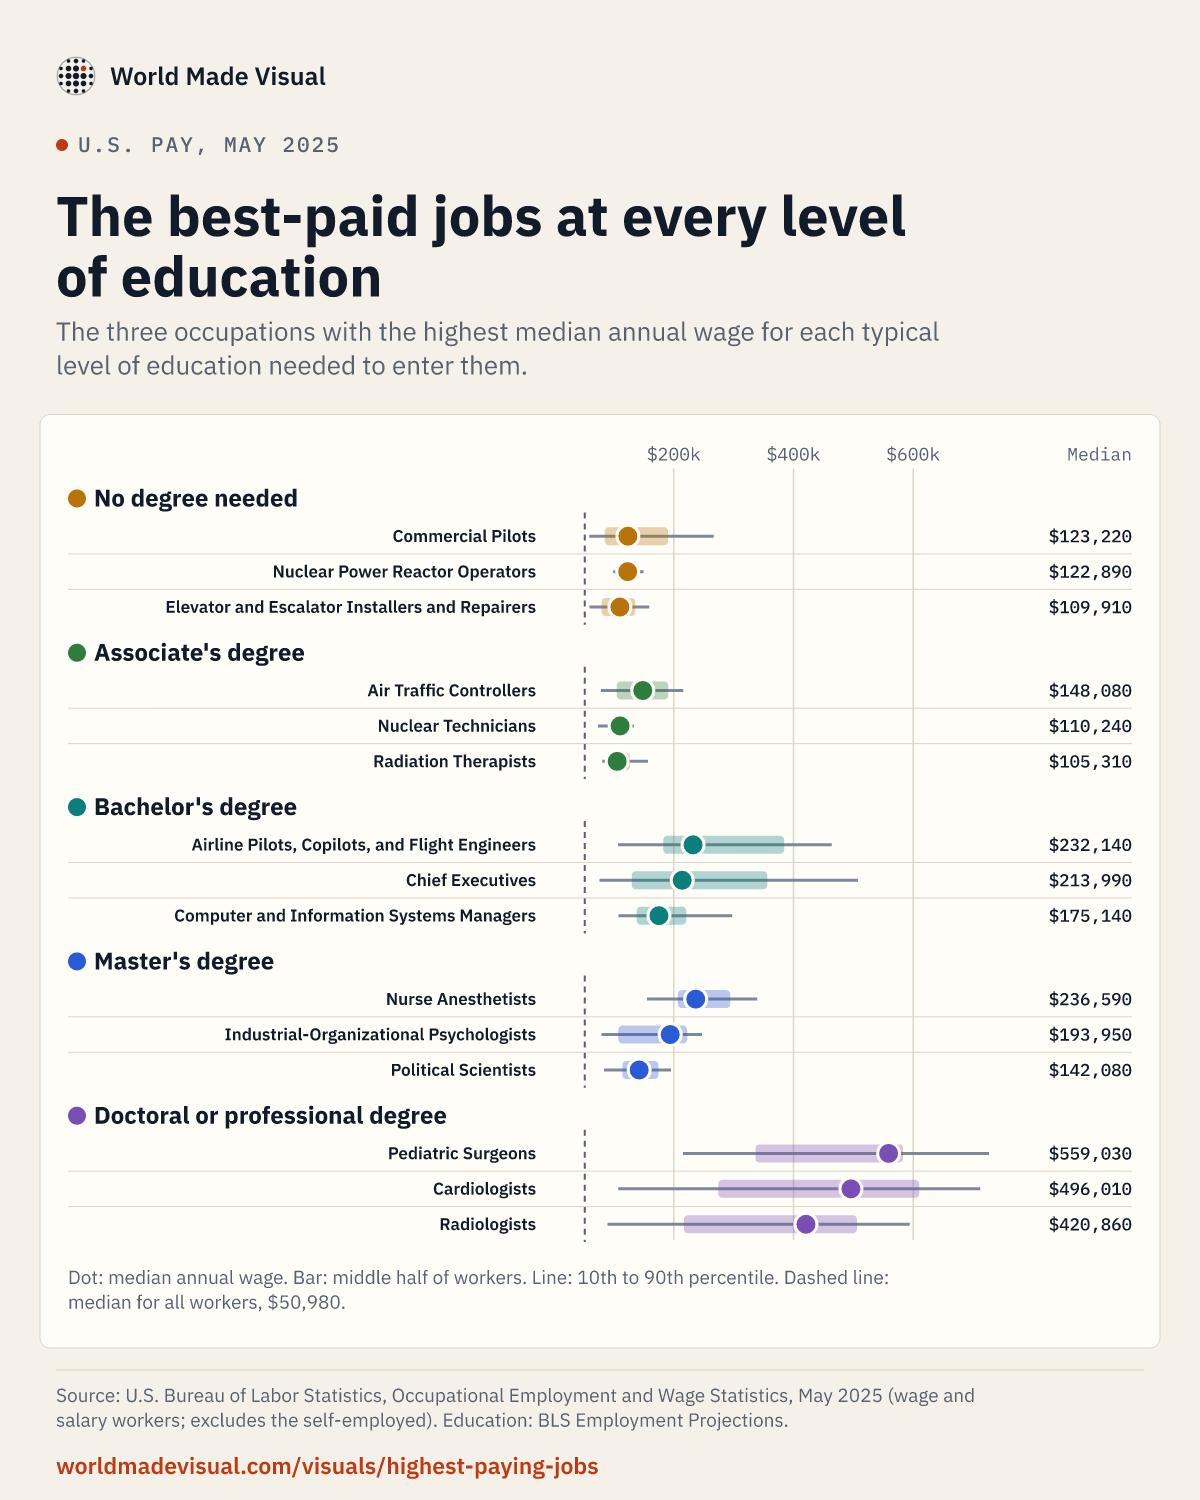 Download the chart PNG, 193 KB
The three best-paid occupations at each level of education, with their pay ranges and the national median. 1200 × 1500 pixels.
- Printable guide PDF, 1.8 MB
A four-page, letter-size guide: the 25 best-paid occupations, the best-paid jobs without a bachelor's degree, with a bachelor's or master's, and what the 25 largest occupations pay.
Free to share and print with credit to World Made Visual and the original sources. Source: U.S. Bureau of Labor Statistics, Occupational Employment and Wage Statistics (May 2025) and Employment Projections (2025–35). Analysis: World Made Visual.
5 excluded from this comparison
- Actors: Paid by the hour without a full-time year; BLS publishes no annual wage, so it is listed without a rank
- Dancers: Paid by the hour without a full-time year; BLS publishes no annual wage, so it is listed without a rank
- Musicians and Singers: Paid by the hour without a full-time year; BLS publishes no annual wage, so it is listed without a rank
- Disc Jockeys, Except Radio: Paid by the hour without a full-time year; BLS publishes no annual wage, so it is listed without a rank
- Entertainers and Performers, Sports and Related Workers, All Other: Paid by the hour without a full-time year; BLS publishes no annual wage, so it is listed without a rank
04
Methodology and sources
Data
Wages and jobs. Occupational Employment and Wage Statistics (OEWS), May 2025, national cross-industry estimates, from the Bureau of Labor Statistics (file oesm25nat.zip, released May 15, 2026). OEWS is a survey of about 1.1 million establishments collected over three years (November 2022 to May 2025) and adjusted to May 2025. It covers wage and salary workers in nonfarm establishments; it excludes the self-employed, owners and partners in unincorporated firms, household workers, most of agriculture, and private households.
OEWS wages are straight-time gross pay: base pay, cost-of-living allowances, guaranteed pay, hazardous-duty pay, incentive pay including commissions and production bonuses, and tips. They exclude overtime, severance, shift differentials, nonproduction bonuses, employer-paid benefits and tuition reimbursement. Annual wages are hourly wages times 2,080 hours, except for occupations paid by the year that usually work fewer hours (such as teachers and pilots), for which BLS publishes annual wages only (58 occupations). For 5 occupations paid by the hour without a full-time year (such as actors and musicians), BLS publishes hourly wages only; they are listed without an annual wage or a rank.
Education, outlook and openings. BLS Employment Projections 2025–35, Table 1.2, "Occupational projections and worker characteristics" (file occupation.xlsx; release of August 27, 2026). For each occupation it gives the education BLS considers typically needed for entry, related work experience, on-the-job training, the projected percent change in jobs from 2025 to 2035 (all jobs: 3.5%), average annual openings, and the share of workers who are self-employed. "Typical education" is an assignment for the occupation as a whole: many workers in it have more or less.
Both files were downloaded on November 7, 2026, checked, and stored as versioned snapshots with the originals. This page calculates in your browser from those snapshots and does not contact BLS when you use it.
Occupations
The ranking uses one level of the 2018 Standard Occupational Classification only: the 830 occupations OEWS publishes at its most detailed level (a few are OEWS combinations of detailed occupations it cannot publish separately). Broader groups are never mixed in. The two tables share occupation codes, and every one of the 830 OEWS occupations has an Employment Projections row; the median wage printed in the projections table matches OEWS for every occupation that has one, which confirms they come from the same release.
Job families are the 22 SOC major groups. For filtering, the education categories are grouped into five: No degree (no formal educational credential; high school diploma or equivalent; some college, no degree; or a postsecondary nondegree award such as a license or certificate), Associate's, Bachelor's, Master's, and Doctoral or professional degree. The close-up shows the exact BLS category.
Measures
- Median: half the occupation's workers are paid more and half less.
- Mean: total pay divided by the number of workers.
- Percentiles: the 10th percentile is the wage below which 10% of workers fall; the 25th, 75th and 90th likewise. The middle half of workers are between the 25th and 75th.
Before May 2025, OEWS showed any wage of $115.00 an hour or $239,200 a year or more only as "at or above" that amount. Beginning with May 2025 it publishes exact values for many of them; none in this release is footnoted that way. If a future release footnotes one, the page shows it as "$239,200 or more", never as a number.
Your pay
The comparison counts the occupations whose median (or mean) is above or below the amount you type, and places it between two of the five percentiles BLS publishes for all occupations and for the occupation in the close-up. It never invents an exact percentile: below the 10th or above the 90th is said as such. The amount stays in your browser. It is not put in shared links, stored, or sent in analytics.
Accuracy
OEWS publishes a relative standard error for each mean wage; for most occupations it is a few percent, larger for small occupations. Treat small differences between neighboring occupations as ties. Employment is rounded to the nearest 10.
Missing values
Five occupations paid by the hour without a full-time year (actors, dancers, musicians and singers, disc jockeys, and other entertainers) have no annual wage from BLS. They stay in the ranking and the table labeled "Not available" with their hourly median, are never shown or counted as zero, and are left out of the dot chart and of counts of occupations. 58 occupations paid by the year (teachers, pilots, some athletes) have no hourly wage. No wage in this release is top-coded; if a later release footnotes one as "$239,200 or more", it will be shown that way, not as a number.
Sources
- 01U.S. Bureau of Labor Statistics, Occupational Employment and Wage Statistics (OEWS), May 2025: national cross-industry estimates (XLSX). The exact file used: oesm25nat.zip (national_M2025_dl.xlsx), released May 15, 2026. The original and its checksum are kept with this story's data version.
- 02U.S. Bureau of Labor Statistics, Occupational Employment and Wages — May 2025 (news release USDL-26-0725) and Technical Note. Release date, survey scope, and the wage definition: straight-time gross pay including commissions and tips, excluding overtime, nonproduction bonuses and benefits.
- 03U.S. Bureau of Labor Statistics, OEWS frequently asked questions. Mean and percentile wages, the 2,080-hour year, the exclusion of the self-employed, and the change, beginning with May 2025, that publishes exact values for many wages previously shown only as "$239,200 or more".
- 04U.S. Bureau of Labor Statistics, Employment Projections 2025–35: occupational projections and worker characteristics (Table 1.2). The exact file used: occupation.xlsx (workbook last modified October 23, 2026). Typical education needed for entry, work experience, training, projected change in jobs 2025–35, and annual openings.
- 05U.S. Bureau of Labor Statistics, Employment Projections — 2025–2035 (news release USDL-26-1422). Released August 27, 2026; total employment is projected to grow 3.5 percent from 2025 to 2035.
- 06U.S. Bureau of Labor Statistics, Employment Projections program, Education and training assignments by detailed occupation: technical documentation. How BLS assigns the typical education, experience and training categories.
- 07U.S. Bureau of Labor Statistics, 2018 Standard Occupational Classification System. Occupation definitions and codes used by both tables.
Data version
- BLS Occupational Employment and Wage Statistics (OEWS): national employment and wage estimates by occupation (U.S. Bureau of Labor Statistics)
- May 2025
- May 15, 2026
- November 7, 2026
- 2025-05-r2026-05-15 (sha256 8c9ea9345986…)
- BLS data are works of the U.S. Government and in the public domain (17 U.S.C. § 105; BLS copyright information page); BLS asks to be cited as the source. The derived table and downloads are offered for reuse with attribution.
- BLS Employment Projections: occupational projections and worker characteristics (Table 1.2) (U.S. Bureau of Labor Statistics)
- Employment 2025, projected 2035
- August 27, 2026
- November 7, 2026
- 2025-35-r2026-08-27 (sha256 d9d06e1f54ac…)
- BLS data are works of the U.S. Government and in the public domain (17 U.S.C. § 105; BLS copyright information page); BLS asks to be cited as the source. The derived table and downloads are offered for reuse with attribution.
Found an error? Send a correction. See also the site-wide methodology.
05
Questions the data raises
What is the highest-paying job in the U.S.?
By median annual wage in May 2025, pediatric surgeons ($559,030), followed by cardiologists and radiologists. All of the top 20 are healthcare practitioners. Outside health care, airline pilots, copilots, and flight engineers lead ($232,140).
What are the highest-paying jobs without a degree?
Among occupations that typically need no degree, commercial pilots ($123,220), nuclear power reactor operators ($122,890) and elevator and escalator installers and repairers ($109,910) lead; with an associate's degree, air traffic controllers ($148,080). Many require a license, training or years of experience. Choose No degree or Associate's in the ranking.
What are the highest-paying jobs that need a bachelor's degree?
Airline Pilots, Copilots, and Flight Engineers ($232,140), chief executives ($213,990) and computer and information systems managers ($175,140). 37% of bachelor's-level occupations have a median of $100,000 or more.
What are the lowest-paying jobs?
The lowest median belongs to cooks, fast food ($30,890), followed by hosts and hostesses, restaurant, lounge, and coffee shop ($31,200) and fast food and counter workers ($31,200). Choose Lowest paid to see the rest.
What is the average salary in the U.S.?
For all wage and salary workers in May 2025, the median annual wage was $50,980 and the mean $69,770. The median is the better guide to a typical worker.
Why don't these numbers match salary websites?
These are BLS survey figures for what employers actually pay, averaged nationally and across industries, excluding overtime, most bonuses and benefits, and the self-employed. Job sites often show advertised salaries or self-reported pay for a specific place and level, which measure something different.
Keep exploring
More visual stories
Money
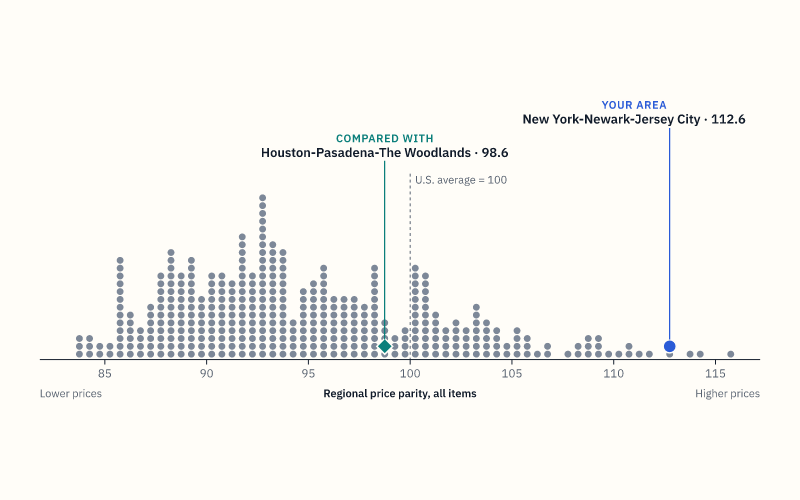
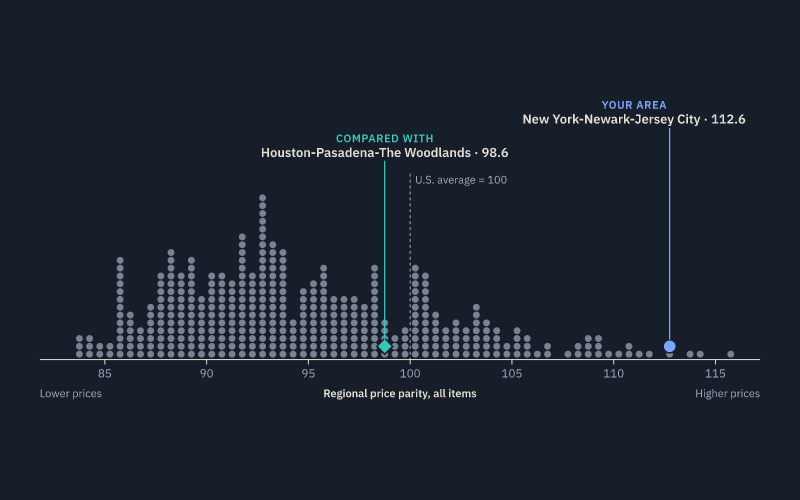
Where does your salary go furthest?
Compare price levels across U.S. metro areas and see what a salary is worth after regional price differences.
Money
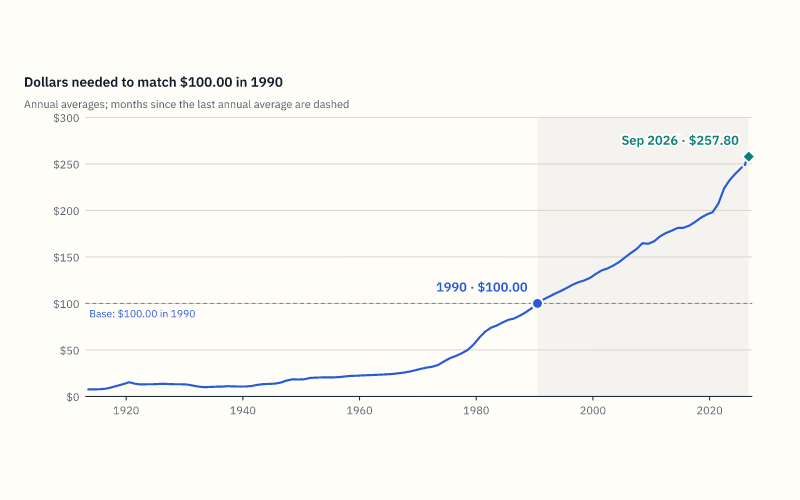
What is a dollar from one year worth in another?
An inflation calculator for U.S. dollars since 1913: enter an amount and two dates to see the equivalent purchasing power, the price change, and how it built up over time.
Food and nutrition
Which common foods have the most fiber?
Fiber in 74 common foods, ranked per serving, per 100 grams and per 100 calories from USDA's food survey database, with a tool to add up a day against the 28-gram Daily Value.