Food and nutrition·Data FNDDS 2021–2023, August 2021–August 2023, Regulation as amended through May 24, 2023
Which common foods have the most fiber?
Beans, peas and lentils lead by a wide margin, and many familiar foods carry less fiber than their reputation. Rank 74 common foods by the serving you would actually eat, by weight, or by calories, then build a day of meals and see how close it comes to the 28-gram Daily Value on food labels and to what Americans actually eat.
- FNDDS 2021–2023, August 2021–August 2023, Regulation as amended through May 24, 2023Released October 31, 2024 by U.S. Department of Agriculture, Agricultural Research Service
All foods: fiber per serving
Top 15 of 74 foods, highest first. Bar colors mark the food group.
Each bar is one food; its length is the fiber in the serving named under it, and the dashed line marks 20% of the Daily Value. Point at or tap a bar to see all three measures; click or tap it again to add the food to your day below. With a keyboard, focus the chart and use the arrow keys, Enter to add, Escape to clear.
Build a day of fiber
This example day is a starting point. Add foods from the ranking above or the list below, and change the servings, to see the total against the 28 g Daily Value on food labels and what Americans actually average.
Your day: 20.6 g of fiber, 73% of the 28 g Daily Value.
7.4 g short of the Daily Value, and 4.3 g more than the average for adults 20 and over (16.3 g).
These are average composition values for foods as USDA describes them, not a measurement of any product you buy, and the Daily Value is a labeling reference for a 2,000-calorie diet, not a personal requirement.
Your day: 20.6 g of fiber, 73% of the 28 g Daily Value. 7.4 g short of the Daily Value, and 4.3 g more than the average for adults 20 and over (16.3 g).
Each colored block is one food in your day, sized by its fiber; the solid line is the 28 g Daily Value and the dashed line the average intake you chose. Point at or tap a block to see the food; click it to find it in the ranking. With a keyboard, focus the bar and use the arrow keys, Enter to find, Escape to clear.
- Oatmeal 1 cup, cooked with water per serving14.1 g
- Banana 1 banana per serving12.1 g
- Whole-wheat bread 1 slice per serving24.3 g
- Apple 1 medium apple per serving14.2 g
- Broccoli 1 cup, cooked per serving13.9 g
- Brown rice 1 cup, cooked per serving12.0 g
01
Key findings
- 01
Beans, peas and lentils lead: 9 of the 10 foods with the most fiber per serving are legumes. A cup of black beans (canned) has 18.2 g, and every bean, pea or lentil measured by the cup has at least 8.0 g.
- 02
25 of the 74 foods reach 5.6 g (20% of the Daily Value) in a typical serving, including 7 vegetables and 3 fruits, but none of the 11 nuts and seeds.
- 03
Choices within a group matter: a cup of raspberries has 9.8 g, 4.6 times a banana's 2.1 g, and whole-wheat bread has 3.4 times the fiber of white bread per slice.
- 04
By weight, Chia seeds lead (34.4 g per 100 g); per calorie, Collard greens do (12.6 g per 100 kcal). Per serving, a tablespoon of chia seeds has 3.6 g.
- 05
U.S. adults averaged 16.3 g of fiber a day in August 2021–August 2023, 58% of the 28 g Daily Value. The example day of oatmeal, fruit, whole-wheat toast, broccoli and brown rice reaches 20.6 g; one cup of lentils lifts it to 34.8 g.
02
Analysis
Beans, peas and lentils lead by a wide margin
Ranked by the serving most people would actually eat, the top of the list is not close. 9 of the 10 foods with the most fiber per serving are beans, peas or lentils. A cup of black beans (canned) has 18.2 g, followed by split peas (14.8 g), kidney beans (14.4 g) and lentils (14.2 g). Every one of the 11 beans, peas and lentils measured by the cup has at least 8.0 g, which is 29% of the 28 g Daily Value printed on food labels. A single cup of lentils covers 51% of it.
The only other food in the top 10 is a cereal made to be high in fiber: a cup of bran flakes has 10.3 g, against 1.1 g for corn flakes.
The dashed line in the ranking marks 5.6 g, 20% of the Daily Value, the share at which the Food and Drug Administration lets a label call a food "high in" fiber. 25 of the 74 foods reach it in the servings shown: 11 beans, peas and lentils, 7 vegetables, 4 grain foods, 3 fruits, and 0 nuts or seeds. FDA measures that claim against its own reference serving for each kind of food, which can differ from the household servings used here, so treat the line as a yardstick rather than a label rule.
Fruit and vegetables vary more than their reputation
"Eat more fruit and vegetables" is good general advice, but for fiber the choice within each group matters. Among fruit, a cup of raspberries has 9.8 g, 4.6 times as much as a banana (2.1 g). A pear (5.6 g) and half an avocado (5.0 g) are next to the berries, while grapes are at the bottom of the fruit list with 1.4 g per cup.
Among vegetables, the leaders are starchy or dense: green peas (7.2 g per cup), an artichoke (7.1 g), a cup of canned pumpkin (6.9 g) and a baked potato eaten with its skin (6.3 g). Leafy greens tell two stories. A cup of raw kale weighs little and has just 1.0 g, and a cup of lettuce 0.5 g, yet cooked greens shrink, so a cup of cooked collard greens holds far more leaf and has 5.6 g.
Whole grains carry far more fiber than refined ones
The grain comparisons are the clearest everyday swaps in the data. A slice of whole-wheat bread has 2.2 g against 0.6 g for white bread (3.4 times as much). A cup of brown rice has 2.0 g against 0.6 g for white rice, and whole-grain pasta 5.5 g against 2.5 g. Oatmeal, often thought of as the high-fiber breakfast, has 4.1 g in a cooked cup: respectable, but less than a cup of bran flakes or bulgur.
Seeds and nuts are rich by weight, modest by the handful
Switch the ranking to Per 100 grams and the order changes completely. Chia seeds lead with 34.4 g per 100 g, and the top five by weight are chia seeds, flax seeds, bran flakes cereal, air-popped popcorn, and shredded wheat cereal: dry, dense foods. But nobody eats 100 grams of chia seeds. A tablespoon has 3.6 g, and an ounce of almonds 3.0 g. None of the 11 nuts and seeds reaches the 5.6 g line in a typical serving. That is why lists of "high-fiber foods" ranked by weight alone can mislead: they reward foods eaten by the spoonful.
Per calorie, vegetables and berries win
Per 100 calories answers a different question: how much fiber a food brings for the energy it adds. Here Collard greens lead with 12.6 g per 100 kcal, and the top five are collard greens, blackberries, raspberries, artichoke, and okra. 7 of the top 10 are vegetables, and the first nut or seed, Chia seeds, comes in at number 12. Almonds have 1.7 g per 100 calories, raspberries 11.4 g.
A "healthy" day can still fall short
The day builder starts with an example that many people would call a high-fiber day: oatmeal, banana, 2 servings of whole-wheat bread, apple, broccoli, and brown rice. It adds up to 20.6 g, or 73% of the Daily Value, still 7.4 g short. Adding one cup of lentils brings the same day to 34.8 g.
Most Americans eat less than even that example. In the federal What We Eat in America survey, adults 20 and over averaged 16.3 g of fiber a day in August 2021–August 2023: 17.7 g for men and 15.0 g for women. The adult average is 58% of the Daily Value, a gap of 11.7 g, about what one cup of beans or lentils adds.
The Daily Value is a labeling reference for a 2,000-calorie diet, not a personal target. The National Academies' recommendation, the Adequate Intake, scales with energy: 14 grams for every 1,000 calories, so people who eat more need more. Either way, the survey means are well below the reference.
What this comparison does not tell you
- These are averages for foods as USDA describes them. A brand of bread, a variety of apple or a can of beans can differ from the figures here. The Nutrition Facts label on a package is the better guide for that product.
- Preparation changes the numbers. The database lists separate entries for raw and cooked, canned and dried, with and without skin. Each food here uses one stated form; the table and the download name the exact USDA entry.
- Fiber is not one thing. Total dietary fiber combines many kinds, which behave differently in the body. This page compares grams, not health effects.
- Survey averages are not shares of people. The intake figures are means from one day of reported eating. They do not say how many Americans fall short, and they exclude fiber supplements.
- This is not dietary advice. People with digestive conditions, or who are adding a lot of fiber quickly, should talk to a clinician or registered dietitian.
03
The data
About the 74 foods and the example day. These are the values behind the chart and findings. Observation period: FNDDS 2021–2023, August 2021–August 2023, Regulation as amended through May 24, 2023.
| Food | Group | Serving | Serving weight (g) | Fiber per serving (g) | Fiber per 100 g (g) | Fiber per 100 kcal (g) | Calories per serving (kcal) |
|---|---|---|---|---|---|---|---|
| Black beans | Beans, peas and lentils | 1 cup, canned | 180.0 | 18.2 | 10.1 | 7.5 | 241 |
| Split peas | Beans, peas and lentils | 1 cup, cooked from dried | 180.0 | 14.8 | 8.2 | 7.0 | 211 |
| Kidney beans | Beans, peas and lentils | 1 cup, canned | 180.0 | 14.4 | 8.0 | 5.9 | 243 |
| Lentils | Beans, peas and lentils | 1 cup, cooked from dried | 180.0 | 14.2 | 7.9 | 6.9 | 207 |
| Pinto beans | Beans, peas and lentils | 1 cup, canned | 180.0 | 13.9 | 7.7 | 5.6 | 247 |
| Chickpeas | Beans, peas and lentils | 1 cup, canned | 180.0 | 13.1 | 7.3 | 5.0 | 263 |
| White beans | Beans, peas and lentils | 1 cup, canned | 180.0 | 13.0 | 7.2 | 4.3 | 302 |
| Lima beans | Beans, peas and lentils | 1 cup, cooked from dried | 185.0 | 12.0 | 6.5 | 3.9 | 305 |
| Baked beans | Beans, peas and lentils | 1 cup | 260.0 | 11.4 | 4.4 | 4.2 | 273 |
| Bran flakes cereal | Grains and cereals | 1 cup | 50.0 | 10.3 | 20.5 | 5.7 | 181 |
| Raspberries | Fruit | 1 cup | 150.0 | 9.8 | 6.5 | 11.4 | 86 |
| Refried beans | Beans, peas and lentils | 1 cup | 260.0 | 9.6 | 3.7 | 4.1 | 234 |
| Blackberries | Fruit | 1 cup | 150.0 | 8.0 | 5.3 | 12.3 | 65 |
| Edamame | Beans, peas and lentils | 1 cup, shelled | 160.0 | 8.0 | 5.0 | 3.6 | 224 |
| Green peas | Vegetables | 1 cup, cooked from frozen | 160.0 | 7.2 | 4.5 | 5.8 | 125 |
| Artichoke | Vegetables | 1 artichoke | 125.0 | 7.1 | 5.7 | 10.8 | 66 |
| Canned pumpkin | Vegetables | 1 cup | 245.0 | 6.9 | 2.8 | 5.0 | 137 |
| Baked potato with skin | Vegetables | 1 medium potato | 285.0 | 6.3 | 2.2 | 2.4 | 265 |
| Barley | Grains and cereals | 1 cup, cooked | 170.0 | 6.3 | 3.7 | 2.7 | 236 |
| Bulgur | Grains and cereals | 1 cup, cooked | 140.0 | 6.3 | 4.5 | 5.4 | 116 |
| Winter squash | Vegetables | 1 cup, cooked | 225.0 | 6.3 | 2.8 | 7.6 | 83 |
| Brussels sprouts | Vegetables | 1 cup, cooked | 155.0 | 6.0 | 3.9 | 8.7 | 70 |
| Shredded wheat cereal | Grains and cereals | 1 cup | 45.0 | 5.9 | 13.0 | 3.6 | 161 |
| Collard greens | Vegetables | 1 cup, cooked | 130.0 | 5.6 | 4.3 | 12.6 | 44 |
| Pear | Fruit | 1 pear | 180.0 | 5.6 | 3.1 | 5.3 | 106 |
| Whole-grain pasta | Grains and cereals | 1 cup, cooked | 140.0 | 5.5 | 3.9 | 2.6 | 207 |
| Okra | Vegetables | 1 cup, cooked | 160.0 | 5.4 | 3.4 | 9.7 | 56 |
| Avocado | Fruit | ½ avocado | 75.0 | 5.0 | 6.7 | 4.2 | 120 |
| Beets | Vegetables | 1 cup, cooked | 170.0 | 4.9 | 2.9 | 6.4 | 77 |
| Quinoa | Grains and cereals | 1 cup, cooked | 170.0 | 4.8 | 2.8 | 2.3 | 204 |
| Sweet potato | Vegetables | 1 medium, baked | 150.0 | 4.7 | 3.1 | 3.8 | 123 |
| Whole-wheat tortilla | Grains and cereals | 1 medium tortilla | 45.0 | 4.4 | 9.8 | 3.2 | 140 |
| Green beans | Vegetables | 1 cup, cooked | 140.0 | 4.3 | 3.1 | 7.4 | 59 |
| Whole-wheat bagel | Grains and cereals | 1 bagel | 105.0 | 4.3 | 4.1 | 1.6 | 263 |
| Apple | Fruit | 1 medium apple | 200.0 | 4.2 | 2.1 | 3.4 | 122 |
| Oatmeal | Grains and cereals | 1 cup, cooked with water | 240.0 | 4.1 | 1.7 | 2.7 | 154 |
| Broccoli | Vegetables | 1 cup, cooked | 155.0 | 3.9 | 2.5 | 6.1 | 64 |
| Blueberries | Fruit | 1 cup | 150.0 | 3.6 | 2.4 | 3.8 | 96 |
| Chia seeds | Nuts and seeds | 1 tablespoon | 10.5 | 3.6 | 34.4 | 7.1 | 51 |
| Air-popped popcorn | Grains and cereals | 3 cups, popped | 24.0 | 3.5 | 14.4 | 3.7 | 92 |
| Orange | Fruit | 1 orange | 154.0 | 3.4 | 2.2 | 4.4 | 77 |
| Spinach | Vegetables | 1 cup, cooked | 180.0 | 3.4 | 1.9 | 5.8 | 59 |
| Cauliflower | Vegetables | 1 cup, cooked | 155.0 | 3.3 | 2.1 | 8.1 | 40 |
| Corn | Vegetables | 1 cup, cooked | 165.0 | 3.3 | 2.0 | 2.3 | 142 |
| Sunflower seeds | Nuts and seeds | 1 oz, shelled | 28.4 | 3.1 | 11.1 | 1.9 | 165 |
| Almonds | Nuts and seeds | 1 oz (about 23 nuts) | 28.4 | 3.0 | 10.6 | 1.7 | 172 |
| Pistachios | Nuts and seeds | 1 oz, shelled | 28.4 | 2.8 | 10.0 | 1.7 | 165 |
| Prunes | Fruit | 5 prunes | 40.0 | 2.8 | 7.1 | 3.0 | 96 |
| Strawberries | Fruit | 1 cup | 150.0 | 2.7 | 1.8 | 5.0 | 54 |
| Mango | Fruit | 1 cup, sliced | 165.0 | 2.6 | 1.6 | 2.7 | 99 |
| Pasta | Grains and cereals | 1 cup, cooked | 140.0 | 2.5 | 1.8 | 1.1 | 220 |
| Flax seeds | Nuts and seeds | 1 tablespoon | 10.5 | 2.4 | 23.1 | 4.2 | 57 |
| Peanuts | Nuts and seeds | 1 oz, dry roasted | 28.4 | 2.4 | 8.4 | 1.4 | 166 |
| Kiwi | Fruit | 1 kiwi | 75.0 | 2.3 | 3.0 | 4.7 | 48 |
| Whole-wheat bread | Grains and cereals | 1 slice | 36.0 | 2.2 | 6.0 | 2.4 | 91 |
| Banana | Fruit | 1 banana | 126.0 | 2.1 | 1.7 | 1.8 | 122 |
| Brown rice | Grains and cereals | 1 cup, cooked | 195.0 | 2.0 | 1.0 | 0.8 | 240 |
| Raisins | Fruit | 1 small box (1.5 oz) | 43.0 | 1.9 | 4.5 | 1.5 | 129 |
| Corn tortilla | Grains and cereals | 1 medium tortilla | 28.0 | 1.8 | 6.3 | 2.9 | 61 |
| Pumpkin seeds | Nuts and seeds | 1 oz, shelled | 28.4 | 1.8 | 6.5 | 1.1 | 163 |
| Carrot | Vegetables | 1 raw carrot | 60.0 | 1.7 | 2.9 | 6.6 | 26 |
| Hummus | Beans, peas and lentils | 2 tablespoons | 30.0 | 1.6 | 5.4 | 2.2 | 73 |
| Peanut butter | Nuts and seeds | 2 tablespoons | 32.0 | 1.6 | 5.0 | 0.8 | 191 |
| Pecans | Nuts and seeds | 1 oz | 28.4 | 1.6 | 5.6 | 0.7 | 214 |
| Tomato | Vegetables | 1 raw tomato | 125.0 | 1.5 | 1.2 | 6.0 | 25 |
| Walnuts | Nuts and seeds | 1 oz | 28.4 | 1.5 | 5.2 | 0.7 | 207 |
| Grapes | Fruit | 1 cup | 150.0 | 1.4 | 0.9 | 1.1 | 125 |
| Corn flakes cereal | Grains and cereals | 1 cup | 30.0 | 1.1 | 3.5 | 1.0 | 110 |
| Raw kale | Vegetables | 1 cup, raw | 25.0 | 1.0 | 4.1 | 9.5 | 11 |
| Cashews | Nuts and seeds | 1 oz | 28.4 | 0.8 | 2.9 | 0.5 | 166 |
| Cucumber | Vegetables | 1 cup, raw | 120.0 | 0.6 | 0.5 | 3.1 | 19 |
| White bread | Grains and cereals | 1 slice | 28.0 | 0.6 | 2.3 | 0.9 | 75 |
| White rice | Grains and cereals | 1 cup, cooked | 158.0 | 0.6 | 0.4 | 0.3 | 204 |
| Lettuce | Vegetables | 1 cup, raw | 35.0 | 0.5 | 1.3 | 6.5 | 7 |
Download the full table as CSV (8 KB). Source: U.S. Department of Agriculture, Agricultural Research Service, FoodData Central: Food and Nutrient Database for Dietary Studies 2021–2023; What We Eat in America, NHANES August 2021–August 2023; FDA Daily Value, 21 CFR 101.9. Analysis: World Made Visual.
Free downloads
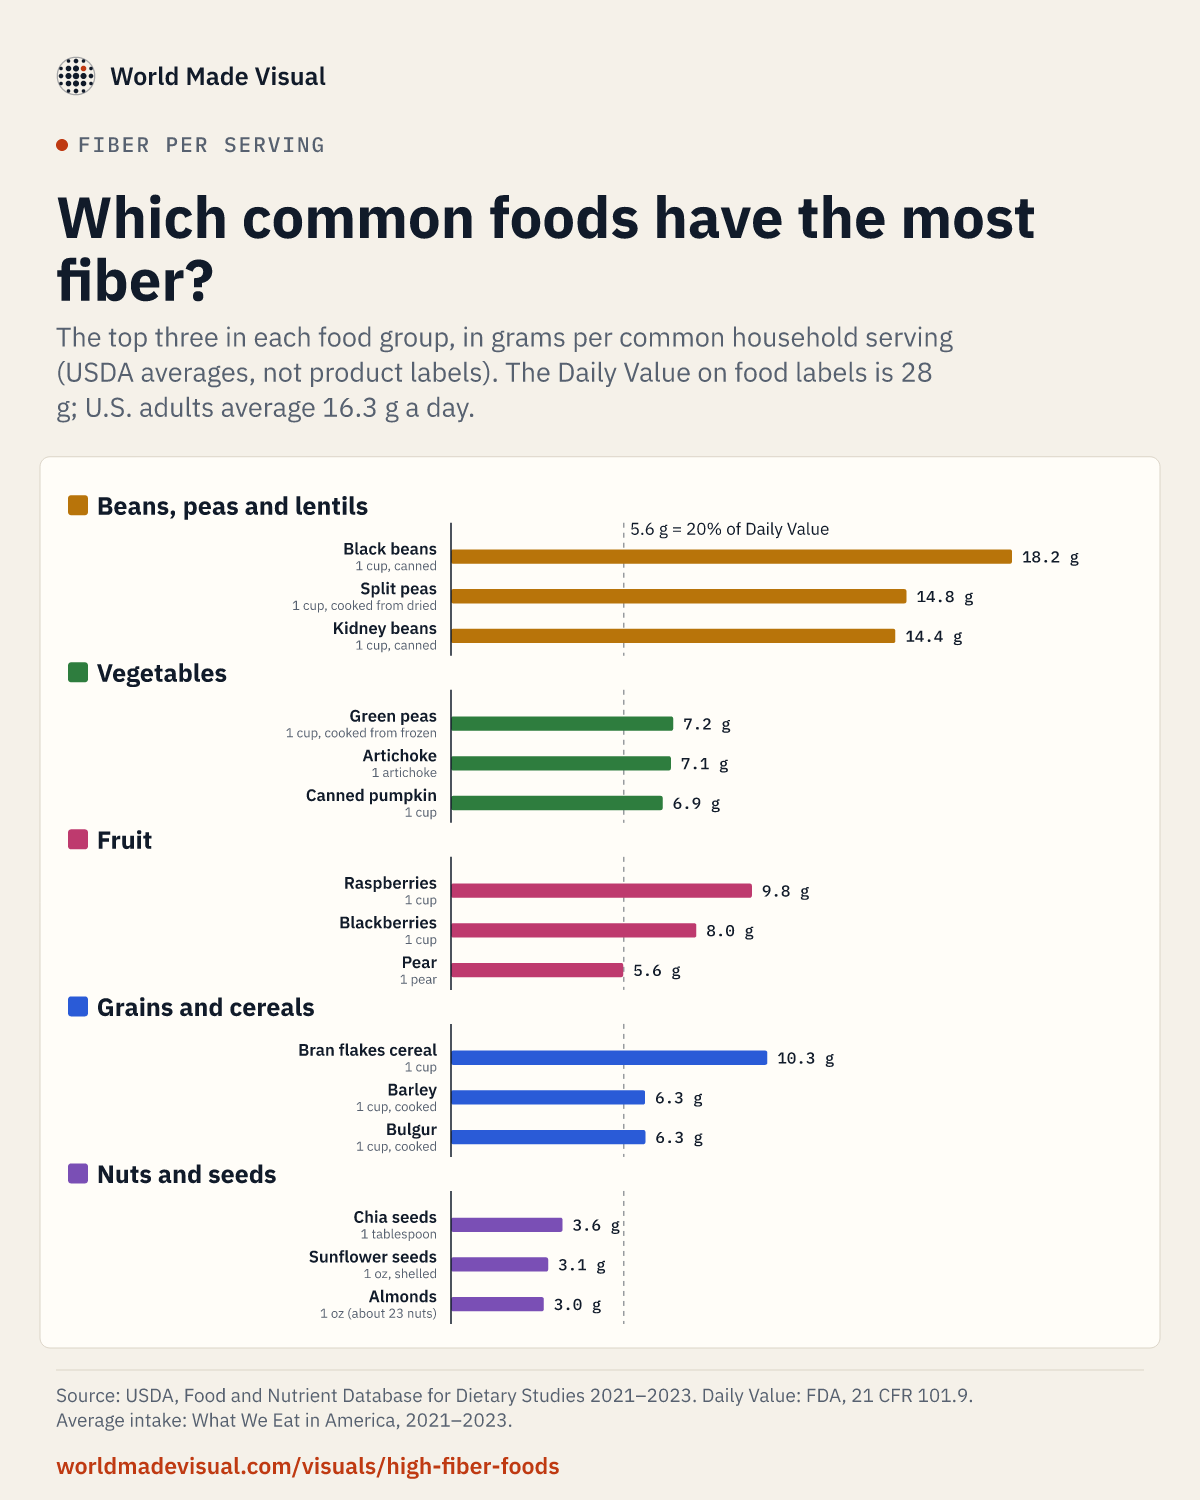 Download the chart PNG, 149 KB
The three foods with the most fiber per serving in each food group, with the Daily Value and the average American intake. 1200 × 1500 pixels.
- Printable guide PDF, 1.3 MB
A four-page, letter-size guide: the ten highest-fiber foods, whole-grain swaps, and tables of all 74 foods per serving, per 100 grams and per 100 calories.
Free to share and print with credit to World Made Visual and the original sources. Source: U.S. Department of Agriculture, Agricultural Research Service, FoodData Central: Food and Nutrient Database for Dietary Studies 2021–2023; What We Eat in America, NHANES August 2021–August 2023; FDA Daily Value, 21 CFR 101.9. Analysis: World Made Visual.
04
Methodology and sources
Data
Foods. Fiber, energy and serving weights come from the U.S. Department of Agriculture's Food and Nutrient Database for Dietary Studies (FNDDS) 2021–2023, released on FoodData Central on October 31, 2024. FNDDS is the database USDA uses to turn what people in the national What We Eat in America survey report eating into nutrients. It describes 5,432 foods "as eaten" (cooked, canned, raw and so on), each with a full set of nutrient values per 100 grams and household portions with documented gram weights. Fiber is FNDDS's "Fiber, total dietary" (nutrient number 291); energy is in kilocalories (nutrient 208). FNDDS draws most of its values from USDA's other composition databases (Foundation Foods and the earlier Standard Reference), and fills recipe foods by calculation.
Average intake. What We Eat in America (WWEIA), NHANES August 2021–August 2023, Table 1: mean dietary fiber from food and beverages per person on day 1 of the dietary interview, by sex and age, for people 2 and over excluding breast-fed children. Dietary supplements are not included. The day builder compares with adults 20 and over (16.3 g), men 20 and over (17.7 g) or women 20 and over (15.0 g). All ages 2 and over averaged 15.9 g.
Daily Value. The Food and Drug Administration's Daily Value for dietary fiber is 28 g for adults and children 4 and over, based on a 2,000-calorie reference intake (21 CFR 101.9(c)(9)). A food may be labeled "high in" fiber at 20% or more of the Daily Value (5.6 g) and a "good source" at 10% to 19% (21 CFR 101.54), both per FDA's reference amount for that kind of food.
All three were downloaded in one pass, checked and stored as versioned snapshots with the original files. USDA publishes the WWEIA tables only as PDFs, so the fiber column was transcribed from the table and tied to that exact file: if USDA changes the PDF, the data refresh refuses to reuse the old numbers until they are checked again. The FDA values are read automatically from the eCFR. This page calculates in your browser from those snapshots and does not contact USDA or FDA when you use it.
Choosing the foods
The 74 foods are a curated set of common, recognizable items across five groups (12 beans, peas and lentils; 20 vegetables; 14 fruits; 17 grains and cereals; 11 nuts and seeds). Each uses one plain FNDDS entry: cooked without added fat where a version exists, raw fruit, and plain unsalted nuts and seeds. Mixed dishes, branded products and supplements are excluded. Some foods with little fiber (white rice, lettuce, grapes) are included on purpose, as familiar points of comparison. The selection is editorial; it is not a complete list of high-fiber foods, and a food's absence says nothing about its fiber.
Servings
Each serving is an FNDDS household portion with its documented gram weight: 1 cup for beans, cooked vegetables, berries, cooked grains and cereal; one piece for whole fruit and vegetables; 1 ounce for nuts and seeds; a slice or one medium tortilla for breads. A few use a stated fraction or multiple of a documented portion: half of FNDDS's "1 fruit" for half an avocado, five times "1 prune", three times "1 cup, popped" for popcorn, twice "1 tablespoon" for hummus and peanut butter, and 1/16 of "1 cup" (one tablespoon) for chia and flax seeds, for which FNDDS documents no tablespoon. The table and the download give the exact portion, weight and multiplier for every food.
These servings are common amounts, not recommendations, and they are not FDA's label reference amounts.
Calculations
With fiber per 100 g F, energy per 100 g E, and serving weight W grams:
- Fiber per serving = F × W ÷ 100
- Fiber per 100 kcal = F ÷ E × 100
- A day's total = the sum, over the foods chosen, of servings × fiber per serving; the share of the Daily Value is that total ÷ 28 g.
Ties in the ranking (equal values to one decimal place) are listed alphabetically. The same code produces the charts, the table, the download and every number in the findings and analysis.
Missing values
Every food selected here has an FNDDS fiber and energy value. If a future release lacks one, the food stays in the list as "Not available", hatched in the chart, is never counted as zero, and is left out of a day's total with a note.
Rounding
Grams are shown to one decimal place and calories to the nearest kilocalorie, after calculating at full precision. FNDDS itself publishes fiber per 100 g to one decimal place, so differences of a few tenths of a gram between similar foods are within rounding.
Checks
Values for raw and simply cooked foods were compared with USDA's Standard Reference Legacy release, where most agree exactly (raspberries, pears, artichokes, lentils, chia seeds). Canned beans are an exception worth knowing about: FNDDS lists more fiber per gram for some beans canned than cooked from dried, and Standard Reference lists less for its canned, low-sodium black beans than FNDDS does for canned black beans. Those sources are not fully independent, since FNDDS derives much of its data from Standard Reference and Foundation Foods.
Missing values
Every food selected has an FNDDS fiber and energy value in this release (FNDDS reports total dietary fiber for 5,431 of its 5,432 foods). If a food ever lacks one, it stays in the list labeled "Not available" and hatched, is never shown or counted as zero, and is left out of a day's total with a note. The WWEIA table reports means with standard errors and no suppressed cells for the adult groups used here.
Sources
- 01U.S. Department of Agriculture, Agricultural Research Service, FoodData Central: Food and Nutrient Database for Dietary Studies (FNDDS) 2021–2023, CSV download. The exact file used: FoodData_Central_survey_food_csv_2024-10-31.zip, released October 31, 2024. The original and its checksum are kept with this story's data version.
- 02U.S. Department of Agriculture, Agricultural Research Service, Food Surveys Research Group, Food and Nutrient Database for Dietary Studies (FNDDS): documentation. How FNDDS foods, nutrient values and portion weights are compiled.
- 03U.S. Department of Agriculture, FoodData Central data documentation and citation. Data types, and the CC0 public-domain dedication.
- 04U.S. Department of Agriculture, Agricultural Research Service, Food Surveys Research Group, What We Eat in America, NHANES August 2021–August 2023: data tables (Table 1, nutrient intakes by sex and age). Mean dietary fiber intake from food and beverages, day 1. The PDF used is kept with this story's data version.
- 05U.S. Food and Drug Administration, via the Electronic Code of Federal Regulations, 21 CFR 101.9, Nutrition labeling of food (Daily Values, paragraph (c)(9)). The 28 g Daily Value for dietary fiber, adults and children 4 years and older.
- 06U.S. Food and Drug Administration, via the Electronic Code of Federal Regulations, 21 CFR 101.54, Nutrient content claims for “good source,” “high,” “more,” and “high potency”. “High” means 20% or more of the Daily Value per reference amount; “good source” 10 to 19%.
- 07National Academies of Sciences, Engineering, and Medicine (Institute of Medicine), Dietary Reference Intakes for Energy, Carbohydrate, Fiber, Fat, Fatty Acids, Cholesterol, Protein, and Amino Acids (2005). The Adequate Intake for total fiber, 14 g per 1,000 kcal; cited for context, not used in calculations.
- 08U.S. Department of Agriculture, Agricultural Research Service, FoodData Central: SR Legacy (April 2018). Used only to cross-check FNDDS values for raw and simply cooked foods.
Data version
- USDA Food and Nutrient Database for Dietary Studies (FNDDS) 2021–2023: dietary fiber, energy, and portion weights for curated common foods (U.S. Department of Agriculture, Agricultural Research Service)
- FNDDS 2021–2023
- October 31, 2024
- November 7, 2026
- 2021-2023-r2024-10-31 (sha256 60b358e69963…)
- USDA FoodData Central data are public domain under the CC0 1.0 dedication; the What We Eat in America tables and the Code of Federal Regulations are works of the U.S. Government, not subject to copyright in the United States. The derived table and download are offered for reuse with attribution.
- What We Eat in America, NHANES August 2021–August 2023, Table 1: mean dietary fiber intake from food and beverages by sex and age (U.S. Department of Agriculture, Agricultural Research Service, Food Surveys Research Group)
- August 2021–August 2023
- Not available
- November 7, 2026
- 2021-2023-t1-2025-04-10 (sha256 c5da087ab002…)
- USDA FoodData Central data are public domain under the CC0 1.0 dedication; the What We Eat in America tables and the Code of Federal Regulations are works of the U.S. Government, not subject to copyright in the United States. The derived table and download are offered for reuse with attribution.
- FDA Daily Value for dietary fiber and nutrient content claim thresholds (21 CFR 101.9 and 101.54) (U.S. Food and Drug Administration, via the Electronic Code of Federal Regulations (Office of the Federal Register))
- Regulation as amended through May 24, 2023
- May 24, 2023
- November 7, 2026
- 101.9-2023-05-24 (sha256 37b28378d3a1…)
- USDA FoodData Central data are public domain under the CC0 1.0 dedication; the What We Eat in America tables and the Code of Federal Regulations are works of the U.S. Government, not subject to copyright in the United States. The derived table and download are offered for reuse with attribution.
Found an error? Send a correction. See also the site-wide methodology.
05
Questions the data raises
Which foods have the most fiber?
Per serving, beans, peas and lentils: a cup of black beans has 18.2 g, and every bean, pea or lentil measured by the cup here has at least 8.0 g. By weight alone, seeds such as chia and flax lead, but they are eaten by the spoonful. Use the ranking's three measures to compare the way that matters to you.
Which fruit has the most fiber?
Raspberries lead the fruits here (9.8 g per cup), followed by blackberries, a pear and half an avocado. A banana has 2.1 g. Choose Fruit in the ranking to see all 14.
Which vegetables are high in fiber?
Green peas (7.2 g per cup), artichokes, canned pumpkin, a baked potato with its skin and winter squash lead the vegetables here. Raw salad greens are light, so a cup holds little fiber. Choose Vegetables to see all 20.
How much fiber is in beans?
Between 8.0 g and 18.2 g per cup for the beans, peas and lentils here, depending on the kind and whether they are canned or cooked from dried. Half a cup has half as much.
How much fiber should I eat in a day?
Food labels use a Daily Value of 28 g, based on a 2,000-calorie diet. The National Academies' Adequate Intake is 14 grams per 1,000 calories. U.S. adults averaged 16.3 g a day in the latest national survey. Your own needs depend on your age, size and health; a clinician or registered dietitian can advise.
What counts as a "high-fiber" food?
On a label, a food can be called "high in" fiber when one reference serving has at least 20% of the Daily Value (5.6 g), and a "good source" at 10% (2.8 g). The ranking draws the 5.6 g line for the servings shown here, which are household amounts rather than FDA's reference servings.
Why do the numbers differ from a package label?
These are USDA averages for a food as described in its database, such as "black beans, from canned". A specific product, brand or recipe can have more or less, and labels round their values. For a packaged food, its own Nutrition Facts label is the better guide.
Can I reuse the data?
Yes. The CSV download lists every food with its USDA food code, description, portion and values. USDA's FoodData Central data are in the public domain; please credit the U.S. Department of Agriculture as the source.
Keep exploring
More visual stories
Money
What is a dollar from one year worth in another?
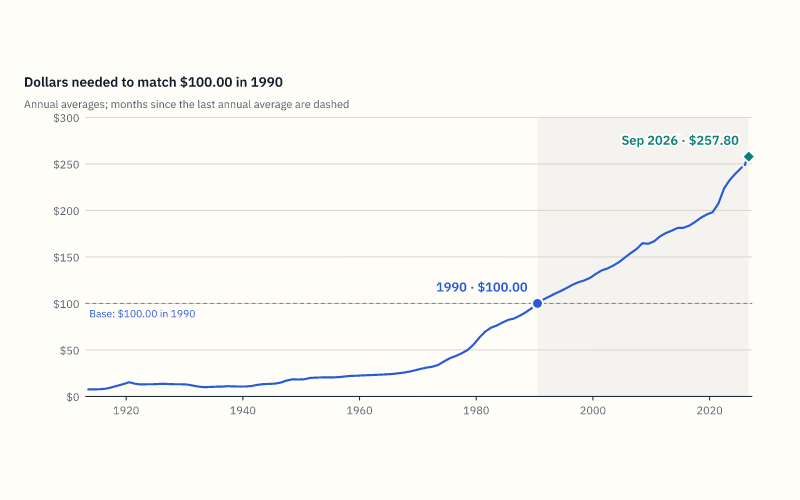
An inflation calculator for U.S. dollars since 1913: enter an amount and two dates to see the equivalent purchasing power, the price change, and how it built up over time.
Money
Where does your salary go furthest?
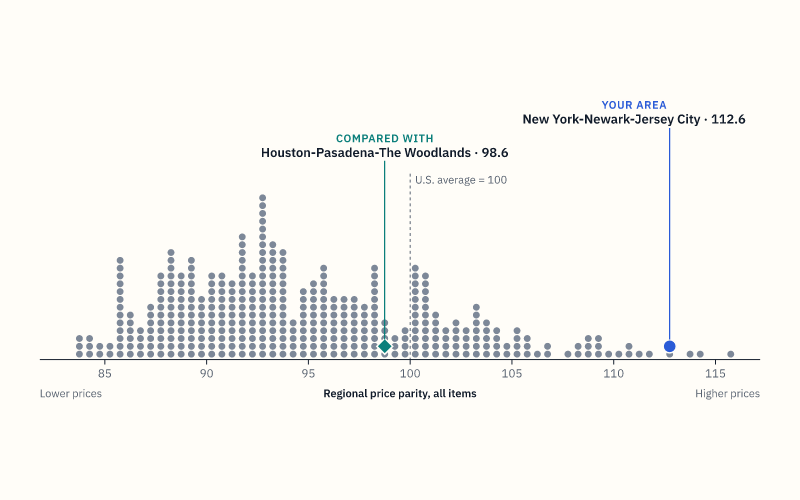
Compare price levels across U.S. metro areas and see what a salary is worth after regional price differences.