Money·Data 2024
Where does your salary go furthest?
Compare price levels across U.S. metro areas and explore how the same salary changes in purchasing power. The comparison uses regional averages and excludes individual tax and household differences.
- 2024Released February 19, 2026 by U.S. Bureau of Economic Analysis
$75,000 in New York-Newark-Jersey City, NY-NJ buys about as much as $65,700 in Houston-Pasadena-The Woodlands, TX.
Prices in Houston-Pasadena-The Woodlands, TX are 12.4% lower than in New York-Newark-Jersey City, NY-NJ.
This compares average consumer prices only. It does not account for taxes, household size, housing choices, or your own spending mix.
Each dot is one metro area. Point at a dot to see which area it is and what your salary would be worth there; click it to compare with it. With a keyboard, focus the chart and use the arrow keys to move between areas, Enter to compare, Escape to clear.
Your metro area
New York-Newark-Jersey City, NY-NJ
- Price level (RPP)
- 112.6
- Versus U.S. average
- +12.6%
- Salary
- $75,000
Compare with
Houston-Pasadena-The Woodlands, TX
- Price level (RPP)
- 98.6
- Versus U.S. average
- −1.4%
- Equivalent salary
- $65,700
At U.S. average prices, both salaries are worth about $66,600.
01
Key findings
- 01
San Francisco-Oakland-Fremont, CA had the highest overall price level of the 387 metro areas, at 115.6. Monroe, LA had the lowest, at 83.6.
- 02
Prices in the most expensive metro area averaged about 38% more than in the least expensive. By this measure, $72,300 in Monroe, LA bought about as much as $100,000 in San Francisco-Oakland-Fremont, CA.
- 03
297 metro areas had price levels below the national average and 90 were above it. The median metro area's price level was 93.5.
- 04
Housing rents varied more than any other part of spending: the housing price level ranged from 42.3 in Johnstown, PA to 211.9 in San Jose-Sunnyvale-Santa Clara, CA, while goods ranged only from 93.6 to 111.6.
02
Analysis
What the comparison shows
Regional price parities (RPPs) describe how expensive a place is compared with the country as a whole in the same year. The U.S. average is 100, so a metro area at 110 had prices about 10% above the national level, and one at 90 had prices about 10% below it.
In 2024, price levels across the 387 metropolitan areas in BEA's table ranged from 83.6 in Monroe, LA to 115.6 in San Francisco-Oakland-Fremont, CA. That gap is wide enough to matter for a salary decision: under this measure, $72,300 in the least expensive metro area covered about the same basket of consumer purchases as $100,000 in the most expensive one.
The default comparison above shows how the same idea works for a specific pair. $75,000 in New York-Newark-Jersey City, NY-NJ (price level 112.6) buys about as much as $65,700 in Houston-Pasadena-The Woodlands, TX (98.6). Choose your own areas to see the equivalent for any pair.
Most metro areas sit below the national average
Only 90 of the 387 metro areas had price levels above 100. The median metro area was at 93.5, about 6.5% below the national level.
That can look contradictory, since the national level is supposed to be an average. A likely explanation, which this table does not measure directly, is that BEA weights each area by how much is spent there. A few large, expensive metro areas therefore pull the national level up, while the many smaller metro areas with lower prices count for less. Places outside metro areas are cheaper still: the nonmetropolitan portion of the country had a price level of 88.7.
Housing explains much of the gap, but not all of it
BEA also publishes price levels for components of spending, and housing rents vary more than any other component. Across metro areas, the housing price level ranged from 42.3 in Johnstown, PA to 211.9 in San Jose-Sunnyvale-Santa Clara, CA. Utilities were the next most variable, from 69.7 to 190.6, while the price level for goods stayed between 93.6 and 111.6.
Metro areas with expensive housing also tend to be expensive overall; the correlation between the two measures across metro areas is 0.94. Part of that relationship is built in, because housing is one of the components of the overall measure, so it should not be read as proof that rent alone sets local prices.
The exceptions are a reminder of that. San Jose-Sunnyvale-Santa Clara, CA had the highest housing price level of any metro area, yet its overall price level of 110.4 ranked 10th, below several areas with less expensive housing. High overall prices are also not limited to the best-known metro areas: Napa, CA (112.6) was nearly level with New York-Newark-Jersey City, NY-NJ (112.6).
What this comparison leaves out
An RPP is an average for a typical consumer in a whole metropolitan area. It does not know what you buy, so the equivalent salaries here are a starting point rather than a personal budget. In particular:
- Taxes are not included. State and local income, sales, and property taxes differ widely and can move the comparison in either direction.
- Housing is measured through rents. BEA estimates housing price levels from rents for tenant-occupied housing. A homeowner with a fixed mortgage, or someone moving into a newly built home, may face very different costs.
- Metro areas are large. A metro area combines a central city with surrounding counties. Prices inside one neighborhood or city limits can differ substantially from the metro average.
- It is one year. RPPs compare places within the same year. They are not a measure of inflation, and a change in a metro area's RPP from one year to the next does not mean its prices fell or rose by that amount.
- Price levels are estimates. BEA builds them from consumer price survey data that was not designed for comparing places, so small differences between metro areas, such as a few tenths of a point, are not meaningful.
None of this makes one metro area a "better" place to live. Pay, job opportunities, and personal circumstances matter at least as much as prices.
03
The data
About the full dataset. These are the values behind the chart and findings. Observation period: 2024.
| Rank | Metro area | RPP (U.S. = 100) | Versus U.S. average | Salary matching $100,000 at U.S. average prices |
|---|---|---|---|---|
| 1 | San Francisco-Oakland-Fremont, CA | 115.6 | +15.6% | $115,600 |
| 2 | Miami-Fort Lauderdale-West Palm Beach, FL | 114.2 | +14.2% | $114,200 |
| 3 | Los Angeles-Long Beach-Anaheim, CA | 113.6 | +13.6% | $113,600 |
| 4 | New York-Newark-Jersey City, NY-NJ | 112.6 | +12.6% | $112,600 |
| 5 | Napa, CA | 112.6 | +12.6% | $112,600 |
| 6 | San Diego-Chula Vista-Carlsbad, CA | 111.9 | +11.9% | $111,900 |
| 7 | Seattle-Tacoma-Bellevue, WA | 111.1 | +11.1% | $111,100 |
| 8 | Urban Honolulu, HI | 111.0 | +11.0% | $111,000 |
| 9 | Oxnard-Thousand Oaks-Ventura, CA | 110.5 | +10.5% | $110,500 |
| 10 | San Jose-Sunnyvale-Santa Clara, CA | 110.4 | +10.4% | $110,400 |
| 11 | Santa Cruz-Watsonville, CA | 109.9 | +9.9% | $109,900 |
| 12 | Kiryas Joel-Poughkeepsie-Newburgh, NY | 109.4 | +9.4% | $109,400 |
| 13 | Kahului-Wailuku, HI | 109.4 | +9.4% | $109,400 |
| 14 | Salinas, CA | 109.0 | +9.0% | $109,000 |
| 15 | Washington-Arlington-Alexandria, DC-VA-MD-WV | 108.9 | +8.9% | $108,900 |
| 16 | Santa Maria-Santa Barbara, CA | 108.8 | +8.8% | $108,800 |
| 17 | San Luis Obispo-Paso Robles, CA | 108.6 | +8.6% | $108,600 |
| 18 | Vallejo, CA | 108.5 | +8.5% | $108,500 |
| 19 | Boston-Cambridge-Newton, MA-NH | 108.3 | +8.3% | $108,300 |
| 20 | Santa Rosa-Petaluma, CA | 107.8 | +7.8% | $107,800 |
| 21 | Bridgeport-Stamford-Danbury, CT | 106.9 | +6.9% | $106,900 |
| 22 | Sacramento-Roseville-Folsom, CA | 106.7 | +6.7% | $106,700 |
| 23 | Riverside-San Bernardino-Ontario, CA | 106.4 | +6.4% | $106,400 |
| 24 | Denver-Aurora-Centennial, CO | 105.8 | +5.8% | $105,800 |
| 25 | Manchester-Nashua, NH | 105.7 | +5.7% | $105,700 |
| 26 | Bremerton-Silverdale-Port Orchard, WA | 105.6 | +5.6% | $105,600 |
| 27 | Portland-Vancouver-Hillsboro, OR-WA | 105.4 | +5.4% | $105,400 |
| 28 | Anchorage, AK | 105.4 | +5.4% | $105,400 |
| 29 | Boulder, CO | 105.2 | +5.2% | $105,200 |
| 30 | Stockton-Lodi, CA | 105.1 | +5.1% | $105,100 |
| 31 | Minneapolis-St. Paul-Bloomington, MN-WI | 104.8 | +4.8% | $104,800 |
| 32 | New Haven, CT | 104.6 | +4.6% | $104,600 |
| 33 | Baltimore-Columbia-Towson, MD | 104.5 | +4.5% | $104,500 |
| 34 | Yuba City, CA | 104.2 | +4.2% | $104,200 |
| 35 | Modesto, CA | 104.1 | +4.1% | $104,100 |
| 36 | Corvallis, OR | 104.0 | +4.0% | $104,000 |
| 37 | Wenatchee-East Wenatchee, WA | 103.9 | +3.9% | $103,900 |
| 38 | Olympia-Lacey-Tumwater, WA | 103.7 | +3.7% | $103,700 |
| 39 | Salem, OR | 103.6 | +3.6% | $103,600 |
| 40 | Bend, OR | 103.6 | +3.6% | $103,600 |
| 41 | Chicago-Naperville-Elgin, IL-IN | 103.6 | +3.6% | $103,600 |
| 42 | Bellingham, WA | 103.3 | +3.3% | $103,300 |
| 43 | Ithaca, NY | 103.3 | +3.3% | $103,300 |
| 44 | Phoenix-Mesa-Chandler, AZ | 103.3 | +3.3% | $103,300 |
| 45 | Fairbanks-College, AK | 103.2 | +3.2% | $103,200 |
| 46 | Naples-Marco Island, FL | 103.2 | +3.2% | $103,200 |
| 47 | Trenton-Princeton, NJ | 103.2 | +3.2% | $103,200 |
| 48 | Dallas-Fort Worth-Arlington, TX | 103.1 | +3.1% | $103,100 |
| 49 | Hartford-West Hartford-East Hartford, CT | 102.7 | +2.7% | $102,700 |
| 50 | Philadelphia-Camden-Wilmington, PA-NJ-DE-MD | 102.6 | +2.6% | $102,600 |
| 51 | Worcester, MA | 102.5 | +2.5% | $102,500 |
| 52 | Bozeman, MT | 102.5 | +2.5% | $102,500 |
| 53 | Mount Vernon-Anacortes, WA | 102.4 | +2.4% | $102,400 |
| 54 | North Port-Bradenton-Sarasota, FL | 102.4 | +2.4% | $102,400 |
| 55 | Cape Coral-Fort Myers, FL | 102.3 | +2.3% | $102,300 |
| 56 | Fresno, CA | 102.2 | +2.2% | $102,200 |
| 57 | Albany, OR | 102.1 | +2.1% | $102,100 |
| 58 | Portland-South Portland, ME | 101.9 | +1.9% | $101,900 |
| 59 | Providence-Warwick, RI-MA | 101.8 | +1.8% | $101,800 |
| 60 | Hanford-Corcoran, CA | 101.6 | +1.6% | $101,600 |
| 61 | Eugene-Springfield, OR | 101.6 | +1.6% | $101,600 |
| 62 | Medford, OR | 101.4 | +1.4% | $101,400 |
| 63 | Orlando-Kissimmee-Sanford, FL | 101.4 | +1.4% | $101,400 |
| 64 | Chico, CA | 101.2 | +1.2% | $101,200 |
| 65 | Fort Collins-Loveland, CO | 101.1 | +1.1% | $101,100 |
| 66 | Kenosha, WI | 101.1 | +1.1% | $101,100 |
| 67 | Reno, NV | 101.0 | +1.0% | $101,000 |
| 68 | Charleston-North Charleston, SC | 101.0 | +1.0% | $101,000 |
| 69 | Burlington-South Burlington, VT | 100.9 | +0.9% | $100,900 |
| 70 | Tampa-St. Petersburg-Clearwater, FL | 100.9 | +0.9% | $100,900 |
| 71 | Bakersfield-Delano, CA | 100.9 | +0.9% | $100,900 |
| 72 | Ann Arbor, MI | 100.9 | +0.9% | $100,900 |
| 73 | Salt Lake City-Murray, UT | 100.9 | +0.9% | $100,900 |
| 74 | Lexington Park, MD | 100.8 | +0.8% | $100,800 |
| 75 | Kingston, NY | 100.7 | +0.7% | $100,700 |
| 76 | Colorado Springs, CO | 100.7 | +0.7% | $100,700 |
| 77 | Redding, CA | 100.7 | +0.7% | $100,700 |
| 78 | Punta Gorda, FL | 100.5 | +0.5% | $100,500 |
| 79 | Norwich-New London-Willimantic, CT | 100.4 | +0.4% | $100,400 |
| 80 | Ogden, UT | 100.3 | +0.3% | $100,300 |
| 81 | Spokane-Spokane Valley, WA | 100.3 | +0.3% | $100,300 |
| 82 | Flagstaff, AZ | 100.3 | +0.3% | $100,300 |
| 83 | Detroit-Warren-Dearborn, MI | 100.3 | +0.3% | $100,300 |
| 84 | Amherst Town-Northampton, MA | 100.2 | +0.2% | $100,200 |
| 85 | Port St. Lucie, FL | 100.2 | +0.2% | $100,200 |
| 86 | Las Vegas-Henderson-North Las Vegas, NV | 100.2 | +0.2% | $100,200 |
| 87 | Greeley, CO | 100.2 | +0.2% | $100,200 |
| 88 | Kennewick-Richland, WA | 100.1 | +0.1% | $100,100 |
| 89 | Atlanta-Sandy Springs-Roswell, GA | 100.1 | +0.1% | $100,100 |
| 90 | Palm Bay-Melbourne-Titusville, FL | 100.0 | 0.0% | $100,000 |
| 91 | Allentown-Bethlehem-Easton, PA-NJ | 100.0 | 0.0% | $100,000 |
| 92 | Visalia, CA | 99.8 | −0.2% | $99,800 |
| 93 | Waterbury-Shelton, CT | 99.8 | −0.2% | $99,800 |
| 94 | Albany-Schenectady-Troy, NY | 99.6 | −0.4% | $99,600 |
| 95 | Jacksonville, FL | 99.5 | −0.5% | $99,500 |
| 96 | Deltona-Daytona Beach-Ormond Beach, FL | 99.4 | −0.6% | $99,400 |
| 97 | Charlottesville, VA | 99.1 | −0.9% | $99,100 |
| 98 | Atlantic City-Hammonton, NJ | 98.9 | −1.1% | $98,900 |
| 99 | Santa Fe, NM | 98.8 | −1.2% | $98,800 |
| 100 | Harrisburg-Carlisle, PA | 98.7 | −1.3% | $98,700 |
| 101 | Houston-Pasadena-The Woodlands, TX | 98.6 | −1.4% | $98,600 |
| 102 | Walla Walla, WA | 98.5 | −1.5% | $98,500 |
| 103 | Boise City, ID | 98.4 | −1.6% | $98,400 |
| 104 | Barnstable Town, MA | 98.4 | −1.6% | $98,400 |
| 105 | Sebastian-Vero Beach-West Vero Corridor, FL | 98.3 | −1.7% | $98,300 |
| 106 | Coeur d'Alene, ID | 98.3 | −1.7% | $98,300 |
| 107 | Merced, CA | 98.3 | −1.7% | $98,300 |
| 108 | Lancaster, PA | 98.3 | −1.7% | $98,300 |
| 109 | Prescott Valley-Prescott, AZ | 98.3 | −1.7% | $98,300 |
| 110 | Provo-Orem-Lehi, UT | 98.2 | −1.8% | $98,200 |
| 111 | Raleigh-Cary, NC | 98.2 | −1.8% | $98,200 |
| 112 | Carson City, NV | 98.1 | −1.9% | $98,100 |
| 113 | Austin-Round Rock-San Marcos, TX | 98.1 | −1.9% | $98,100 |
| 114 | Hilton Head Island-Bluffton-Port Royal, SC | 98.0 | −2.0% | $98,000 |
| 115 | Virginia Beach-Chesapeake-Norfolk, VA-NC | 97.9 | −2.1% | $97,900 |
| 116 | Richmond, VA | 97.9 | −2.1% | $97,900 |
| 117 | Grants Pass, OR | 97.8 | −2.2% | $97,800 |
| 118 | Pensacola-Ferry Pass-Brent, FL | 97.7 | −2.3% | $97,700 |
| 119 | Durham-Chapel Hill, NC | 97.6 | −2.4% | $97,600 |
| 120 | Longview-Kelso, WA | 97.5 | −2.5% | $97,500 |
| 121 | Dover, DE | 97.5 | −2.5% | $97,500 |
| 122 | Charlotte-Concord-Gastonia, NC-SC | 97.3 | −2.7% | $97,300 |
| 123 | St. George, UT | 97.3 | −2.7% | $97,300 |
| 124 | Panama City-Panama City Beach, FL | 97.3 | −2.7% | $97,300 |
| 125 | Madison, WI | 97.3 | −2.7% | $97,300 |
| 126 | Lakeland-Winter Haven, FL | 97.1 | −2.9% | $97,100 |
| 127 | Reading, PA | 97.1 | −2.9% | $97,100 |
| 128 | Rochester, NY | 97.0 | −3.0% | $97,000 |
| 129 | Crestview-Fort Walton Beach-Destin, FL | 97.0 | −3.0% | $97,000 |
| 130 | Milwaukee-Waukesha, WI | 96.9 | −3.1% | $96,900 |
| 131 | Tucson, AZ | 96.9 | −3.1% | $96,900 |
| 132 | Great Falls, MT | 96.8 | −3.2% | $96,800 |
| 133 | Gainesville, GA | 96.8 | −3.2% | $96,800 |
| 134 | State College, PA | 96.8 | −3.2% | $96,800 |
| 135 | Gainesville, FL | 96.7 | −3.3% | $96,700 |
| 136 | Bangor, ME | 96.5 | −3.5% | $96,500 |
| 137 | Asheville, NC | 96.5 | −3.5% | $96,500 |
| 138 | Cheyenne, WY | 96.5 | −3.5% | $96,500 |
| 139 | Winchester, VA-WV | 96.5 | −3.5% | $96,500 |
| 140 | Missoula, MT | 96.4 | −3.6% | $96,400 |
| 141 | Wilmington, NC | 96.4 | −3.6% | $96,400 |
| 142 | Kankakee, IL | 96.4 | −3.6% | $96,400 |
| 143 | Nashville-Davidson--Murfreesboro--Franklin, TN | 96.3 | −3.7% | $96,300 |
| 144 | Springfield, MA | 96.1 | −3.9% | $96,100 |
| 145 | York-Hanover, PA | 96.0 | −4.0% | $96,000 |
| 146 | Vineland, NJ | 96.0 | −4.0% | $96,000 |
| 147 | Racine-Mount Pleasant, WI | 96.0 | −4.0% | $96,000 |
| 148 | Logan, UT-ID | 95.9 | −4.1% | $95,900 |
| 149 | Buffalo-Cheektowaga, NY | 95.8 | −4.2% | $95,800 |
| 150 | Midland, TX | 95.8 | −4.2% | $95,800 |
| 151 | Syracuse, NY | 95.7 | −4.3% | $95,700 |
| 152 | Indianapolis-Carmel-Greenwood, IN | 95.7 | −4.3% | $95,700 |
| 153 | Helena, MT | 95.7 | −4.3% | $95,700 |
| 154 | Salisbury, MD | 95.6 | −4.4% | $95,600 |
| 155 | Albuquerque, NM | 95.5 | −4.5% | $95,500 |
| 155 | Grand Rapids-Wyoming-Kentwood, MI | 95.5 | −4.5% | $95,500 |
| 157 | Yakima, WA | 95.5 | −4.5% | $95,500 |
| 158 | Grand Junction, CO | 95.5 | −4.5% | $95,500 |
| 159 | Columbus, OH | 95.5 | −4.5% | $95,500 |
| 160 | Gettysburg, PA | 95.4 | −4.6% | $95,400 |
| 161 | Cincinnati, OH-KY-IN | 95.4 | −4.6% | $95,400 |
| 162 | Ocala, FL | 95.2 | −4.8% | $95,200 |
| 163 | Savannah, GA | 95.2 | −4.8% | $95,200 |
| 164 | El Centro, CA | 95.2 | −4.8% | $95,200 |
| 165 | Pittsfield, MA | 95.1 | −4.9% | $95,100 |
| 166 | St. Louis, MO-IL | 95.1 | −4.9% | $95,100 |
| 167 | Bloomington, IN | 95.1 | −4.9% | $95,100 |
| 168 | Lansing-East Lansing, MI | 95.0 | −5.0% | $95,000 |
| 169 | Harrisonburg, VA | 94.9 | −5.1% | $94,900 |
| 170 | Glens Falls, NY | 94.9 | −5.1% | $94,900 |
| 171 | Kalamazoo-Portage, MI | 94.8 | −5.2% | $94,800 |
| 172 | Lewiston-Auburn, ME | 94.7 | −5.3% | $94,700 |
| 173 | San Antonio-New Braunfels, TX | 94.7 | −5.3% | $94,700 |
| 174 | Daphne-Fairhope-Foley, AL | 94.7 | −5.3% | $94,700 |
| 175 | Pittsburgh, PA | 94.7 | −5.3% | $94,700 |
| 176 | Chambersburg, PA | 94.6 | −5.4% | $94,600 |
| 177 | Idaho Falls, ID | 94.4 | −5.6% | $94,400 |
| 178 | Elmira, NY | 94.4 | −5.6% | $94,400 |
| 179 | Hagerstown-Martinsburg, MD-WV | 94.2 | −5.8% | $94,200 |
| 180 | Lake Havasu City-Kingman, AZ | 94.1 | −5.9% | $94,100 |
| 181 | Sheboygan, WI | 94.0 | −6.0% | $94,000 |
| 182 | Hinesville, GA | 93.9 | −6.1% | $93,900 |
| 183 | Cleveland, OH | 93.9 | −6.1% | $93,900 |
| 184 | Tallahassee, FL | 93.9 | −6.1% | $93,900 |
| 185 | Odessa, TX | 93.9 | −6.1% | $93,900 |
| 186 | Casper, WY | 93.8 | −6.2% | $93,800 |
| 187 | Warner Robins, GA | 93.8 | −6.2% | $93,800 |
| 188 | Sherman-Denison, TX | 93.8 | −6.2% | $93,800 |
| 189 | Janesville-Beloit, WI | 93.7 | −6.3% | $93,700 |
| 190 | Columbia, SC | 93.7 | −6.3% | $93,700 |
| 191 | Myrtle Beach-Conway-North Myrtle Beach, SC | 93.6 | −6.4% | $93,600 |
| 192 | Roanoke, VA | 93.6 | −6.4% | $93,600 |
| 193 | Scranton--Wilkes-Barre, PA | 93.6 | −6.4% | $93,600 |
| 194 | Bloomington, IL | 93.5 | −6.5% | $93,500 |
| 195 | Billings, MT | 93.5 | −6.5% | $93,500 |
| 196 | Monroe, MI | 93.5 | −6.5% | $93,500 |
| 197 | Homosassa Springs, FL | 93.5 | −6.5% | $93,500 |
| 198 | Lafayette-West Lafayette, IN | 93.4 | −6.6% | $93,400 |
| 199 | Traverse City, MI | 93.4 | −6.6% | $93,400 |
| 200 | Akron, OH | 93.4 | −6.6% | $93,400 |
| 201 | Athens-Clarke County, GA | 93.3 | −6.7% | $93,300 |
| 202 | Morgantown, WV | 93.3 | −6.7% | $93,300 |
| 203 | Greenville-Anderson-Greer, SC | 93.3 | −6.7% | $93,300 |
| 204 | Lebanon, PA | 93.2 | −6.8% | $93,200 |
| 205 | Burlington, NC | 93.2 | −6.8% | $93,200 |
| 206 | Green Bay, WI | 93.1 | −6.9% | $93,100 |
| 207 | Louisville/Jefferson County, KY-IN | 93.1 | −6.9% | $93,100 |
| 208 | Huntsville, AL | 93.1 | −6.9% | $93,100 |
| 209 | Flint, MI | 93.0 | −7.0% | $93,000 |
| 210 | Columbus, IN | 93.0 | −7.0% | $93,000 |
| 211 | Oshkosh-Neenah, WI | 92.9 | −7.1% | $92,900 |
| 212 | Lexington-Fayette, KY | 92.9 | −7.1% | $92,900 |
| 213 | Greensboro-High Point, NC | 92.9 | −7.1% | $92,900 |
| 214 | Binghamton, NY | 92.9 | −7.1% | $92,900 |
| 215 | South Bend-Mishawaka, IN-MI | 92.9 | −7.1% | $92,900 |
| 216 | Eau Claire, WI | 92.8 | −7.2% | $92,800 |
| 217 | Springfield, IL | 92.7 | −7.3% | $92,700 |
| 218 | Slidell-Mandeville-Covington, LA | 92.7 | −7.3% | $92,700 |
| 219 | Blacksburg-Christiansburg-Radford, VA | 92.7 | −7.3% | $92,700 |
| 220 | Yuma, AZ | 92.7 | −7.3% | $92,700 |
| 221 | Champaign-Urbana, IL | 92.7 | −7.3% | $92,700 |
| 222 | Dayton-Kettering-Beavercreek, OH | 92.7 | −7.3% | $92,700 |
| 223 | Utica-Rome, NY | 92.7 | −7.3% | $92,700 |
| 224 | Corpus Christi, TX | 92.7 | −7.3% | $92,700 |
| 225 | Wausau, WI | 92.7 | −7.3% | $92,700 |
| 226 | New Orleans-Metairie, LA | 92.6 | −7.4% | $92,600 |
| 227 | Fort Wayne, IN | 92.6 | −7.4% | $92,600 |
| 228 | Knoxville, TN | 92.6 | −7.4% | $92,600 |
| 229 | Waco, TX | 92.6 | −7.5% | $92,600 |
| 230 | Kansas City, MO-KS | 92.5 | −7.5% | $92,500 |
| 231 | Muskegon-Norton Shores, MI | 92.5 | −7.5% | $92,500 |
| 232 | Sebring, FL | 92.5 | −7.5% | $92,500 |
| 233 | San Angelo, TX | 92.5 | −7.5% | $92,500 |
| 234 | Appleton, WI | 92.4 | −7.6% | $92,400 |
| 235 | Niles, MI | 92.4 | −7.6% | $92,400 |
| 236 | Williamsport, PA | 92.4 | −7.7% | $92,400 |
| 237 | Memphis, TN-MS-AR | 92.2 | −7.8% | $92,200 |
| 238 | Tyler, TX | 92.2 | −7.8% | $92,200 |
| 239 | Rockford, IL | 92.2 | −7.8% | $92,200 |
| 240 | Twin Falls, ID | 92.1 | −7.9% | $92,100 |
| 241 | Jacksonville, NC | 92.1 | −7.9% | $92,100 |
| 242 | Winston-Salem, NC | 92.0 | −8.0% | $92,000 |
| 243 | Fayetteville, NC | 92.0 | −8.0% | $92,000 |
| 244 | Bay City, MI | 91.9 | −8.1% | $91,900 |
| 244 | Midland, MI | 91.9 | −8.1% | $91,900 |
| 246 | Omaha, NE-IA | 91.9 | −8.1% | $91,900 |
| 247 | Augusta-Richmond County, GA-SC | 91.9 | −8.1% | $91,900 |
| 248 | Amarillo, TX | 91.8 | −8.2% | $91,800 |
| 249 | Jackson, MI | 91.8 | −8.2% | $91,800 |
| 250 | La Crosse-Onalaska, WI-MN | 91.8 | −8.2% | $91,800 |
| 251 | Pueblo, CO | 91.8 | −8.2% | $91,800 |
| 252 | Des Moines-West Des Moines, IA | 91.7 | −8.3% | $91,700 |
| 253 | Michigan City-La Porte, IN | 91.7 | −8.3% | $91,700 |
| 254 | Birmingham, AL | 91.6 | −8.4% | $91,600 |
| 255 | Fond du Lac, WI | 91.6 | −8.4% | $91,600 |
| 256 | Lincoln, NE | 91.6 | −8.4% | $91,600 |
| 257 | Evansville, IN | 91.5 | −8.5% | $91,500 |
| 258 | Iowa City, IA | 91.5 | −8.5% | $91,500 |
| 259 | Chattanooga, TN-GA | 91.5 | −8.5% | $91,500 |
| 260 | Toledo, OH | 91.5 | −8.5% | $91,500 |
| 261 | Fayetteville-Springdale-Rogers, AR | 91.4 | −8.6% | $91,400 |
| 262 | Lubbock, TX | 91.3 | −8.7% | $91,300 |
| 263 | Peoria, IL | 91.2 | −8.8% | $91,200 |
| 264 | Lewiston, ID-WA | 91.2 | −8.8% | $91,200 |
| 265 | Killeen-Temple, TX | 91.1 | −8.9% | $91,100 |
| 266 | Staunton-Stuarts Draft, VA | 91.1 | −8.9% | $91,100 |
| 267 | Spartanburg, SC | 91.1 | −8.9% | $91,100 |
| 268 | Bismarck, ND | 91.0 | −9.0% | $91,000 |
| 269 | Mankato, MN | 91.0 | −9.0% | $91,000 |
| 270 | College Station-Bryan, TX | 91.0 | −9.0% | $91,000 |
| 271 | Erie, PA | 91.0 | −9.1% | $91,000 |
| 272 | Clarksville, TN-KY | 90.9 | −9.1% | $90,900 |
| 273 | Saginaw, MI | 90.9 | −9.1% | $90,900 |
| 274 | Fargo, ND-MN | 90.9 | −9.1% | $90,900 |
| 275 | Rochester, MN | 90.8 | −9.2% | $90,800 |
| 276 | Baton Rouge, LA | 90.8 | −9.2% | $90,800 |
| 277 | Sioux Falls, SD-MN | 90.6 | −9.4% | $90,600 |
| 278 | Elizabethtown, KY | 90.6 | −9.4% | $90,600 |
| 279 | Battle Creek, MI | 90.5 | −9.5% | $90,500 |
| 280 | Springfield, OH | 90.5 | −9.5% | $90,500 |
| 281 | Oklahoma City, OK | 90.4 | −9.6% | $90,400 |
| 282 | Abilene, TX | 90.4 | −9.6% | $90,400 |
| 283 | Elkhart-Goshen, IN | 90.3 | −9.7% | $90,300 |
| 284 | Lawrence, KS | 90.2 | −9.8% | $90,200 |
| 285 | Las Cruces, NM | 90.2 | −9.8% | $90,200 |
| 286 | Bowling Green, KY | 90.2 | −9.8% | $90,200 |
| 287 | Manhattan, KS | 90.2 | −9.8% | $90,200 |
| 288 | Rome, GA | 90.2 | −9.8% | $90,200 |
| 289 | Beaumont-Port Arthur, TX | 90.0 | −10.0% | $90,000 |
| 290 | Gulfport-Biloxi, MS | 90.0 | −10.0% | $90,000 |
| 291 | El Paso, TX | 89.9 | −10.1% | $89,900 |
| 292 | Dalton, GA | 89.8 | −10.2% | $89,800 |
| 293 | Victoria, TX | 89.8 | −10.2% | $89,800 |
| 294 | Montgomery, AL | 89.7 | −10.3% | $89,700 |
| 295 | Lima, OH | 89.7 | −10.3% | $89,700 |
| 296 | Kokomo, IN | 89.6 | −10.4% | $89,600 |
| 297 | Wichita Falls, TX | 89.5 | −10.5% | $89,500 |
| 298 | Altoona, PA | 89.5 | −10.5% | $89,500 |
| 299 | Longview, TX | 89.5 | −10.5% | $89,500 |
| 300 | Columbia, MO | 89.4 | −10.6% | $89,400 |
| 301 | Canton-Massillon, OH | 89.4 | −10.6% | $89,400 |
| 302 | Little Rock-North Little Rock-Conway, AR | 89.4 | −10.6% | $89,400 |
| 303 | Lynchburg, VA | 89.4 | −10.6% | $89,400 |
| 304 | Columbus, GA-AL | 89.3 | −10.7% | $89,300 |
| 305 | Sandusky, OH | 89.3 | −10.7% | $89,300 |
| 306 | Sierra Vista-Douglas, AZ | 89.2 | −10.8% | $89,200 |
| 307 | Tulsa, OK | 89.2 | −10.8% | $89,200 |
| 308 | Rapid City, SD | 89.2 | −10.8% | $89,200 |
| 309 | Davenport-Moline-Rock Island, IA-IL | 89.1 | −10.9% | $89,100 |
| 310 | Jackson, MS | 89.0 | −11.0% | $89,000 |
| 311 | Weirton-Steubenville, WV-OH | 89.0 | −11.0% | $89,000 |
| 312 | Cedar Rapids, IA | 89.0 | −11.0% | $89,000 |
| 313 | Wichita, KS | 88.9 | −11.1% | $88,900 |
| 314 | Pocatello, ID | 88.9 | −11.1% | $88,900 |
| 315 | Mansfield, OH | 88.9 | −11.1% | $88,900 |
| 316 | Ames, IA | 88.8 | −11.2% | $88,800 |
| 317 | Topeka, KS | 88.8 | −11.2% | $88,800 |
| 318 | Duluth, MN-WI | 88.8 | −11.2% | $88,800 |
| 319 | Charleston, WV | 88.7 | −11.3% | $88,700 |
| 320 | Owensboro, KY | 88.6 | −11.4% | $88,600 |
| 321 | Springfield, MO | 88.6 | −11.4% | $88,600 |
| 322 | Macon-Bibb County, GA | 88.5 | −11.5% | $88,500 |
| 323 | Hickory-Lenoir-Morganton, NC | 88.5 | −11.5% | $88,500 |
| 324 | Goldsboro, NC | 88.5 | −11.5% | $88,500 |
| 325 | Decatur, IL | 88.4 | −11.6% | $88,400 |
| 325 | Huntington-Ashland, WV-KY-OH | 88.4 | −11.6% | $88,400 |
| 327 | Greenville, NC | 88.4 | −11.6% | $88,400 |
| 328 | Beckley, WV | 88.4 | −11.6% | $88,400 |
| 329 | Pinehurst-Southern Pines, NC | 88.3 | −11.7% | $88,300 |
| 330 | Wheeling, WV-OH | 88.3 | −11.7% | $88,300 |
| 331 | Valdosta, GA | 88.3 | −11.7% | $88,300 |
| 332 | Muncie, IN | 88.1 | −11.9% | $88,100 |
| 333 | Mobile, AL | 88.1 | −11.9% | $88,100 |
| 334 | Cleveland, TN | 88.1 | −11.9% | $88,100 |
| 335 | Sumter, SC | 88.0 | −12.0% | $88,000 |
| 336 | Rocky Mount, NC | 88.0 | −12.0% | $88,000 |
| 337 | Jefferson City, MO | 88.0 | −12.0% | $88,000 |
| 338 | Auburn-Opelika, AL | 87.9 | −12.1% | $87,900 |
| 339 | Johnson City, TN | 87.9 | −12.1% | $87,900 |
| 340 | Terre Haute, IN | 87.8 | −12.2% | $87,800 |
| 341 | Tuscaloosa, AL | 87.7 | −12.3% | $87,700 |
| 342 | Brunswick-St. Simons, GA | 87.7 | −12.3% | $87,700 |
| 343 | Farmington, NM | 87.7 | −12.3% | $87,700 |
| 344 | Watertown-Fort Drum, NY | 87.7 | −12.3% | $87,700 |
| 345 | Albany, GA | 87.7 | −12.3% | $87,700 |
| 346 | Hattiesburg, MS | 87.6 | −12.4% | $87,600 |
| 347 | St. Cloud, MN | 87.6 | −12.4% | $87,600 |
| 348 | Youngstown-Warren, OH | 87.4 | −12.6% | $87,400 |
| 349 | Dubuque, IA | 87.3 | −12.7% | $87,300 |
| 350 | Decatur, AL | 87.2 | −12.8% | $87,200 |
| 351 | Lafayette, LA | 87.2 | −12.8% | $87,200 |
| 352 | Parkersburg-Vienna, WV | 87.1 | −12.9% | $87,100 |
| 353 | Waterloo-Cedar Falls, IA | 87.1 | −12.9% | $87,100 |
| 354 | Minot, ND | 87.0 | −13.0% | $87,000 |
| 355 | Laredo, TX | 87.0 | −13.0% | $87,000 |
| 356 | Florence, SC | 86.8 | −13.2% | $86,800 |
| 357 | Grand Forks, ND-MN | 86.7 | −13.3% | $86,700 |
| 358 | Grand Island, NE | 86.7 | −13.3% | $86,700 |
| 359 | Sioux City, IA-NE-SD | 86.5 | −13.5% | $86,500 |
| 360 | Kingsport-Bristol, TN-VA | 86.4 | −13.6% | $86,400 |
| 361 | St. Joseph, MO-KS | 86.4 | −13.6% | $86,400 |
| 362 | Morristown, TN | 86.4 | −13.6% | $86,400 |
| 363 | Paducah, KY-IL | 86.1 | −13.9% | $86,100 |
| 364 | Cape Girardeau, MO-IL | 86.1 | −13.9% | $86,100 |
| 365 | Brownsville-Harlingen, TX | 86.0 | −14.0% | $86,000 |
| 366 | Anniston-Oxford, AL | 85.9 | −14.1% | $85,900 |
| 367 | Lawton, OK | 85.9 | −14.1% | $85,900 |
| 368 | Johnstown, PA | 85.9 | −14.1% | $85,900 |
| 369 | McAllen-Edinburg-Mission, TX | 85.9 | −14.1% | $85,900 |
| 370 | Fort Smith, AR-OK | 85.9 | −14.1% | $85,900 |
| 371 | Jonesboro, AR | 85.9 | −14.1% | $85,900 |
| 372 | Lake Charles, LA | 85.9 | −14.1% | $85,900 |
| 373 | Hot Springs, AR | 85.7 | −14.3% | $85,700 |
| 374 | Joplin, MO-KS | 85.7 | −14.3% | $85,700 |
| 375 | Alexandria, LA | 85.7 | −14.3% | $85,700 |
| 376 | Gadsden, AL | 85.7 | −14.3% | $85,700 |
| 377 | Jackson, TN | 85.5 | −14.5% | $85,500 |
| 378 | Wildwood-The Villages, FL | 85.4 | −14.6% | $85,400 |
| 379 | Houma-Bayou Cane-Thibodaux, LA | 85.1 | −14.9% | $85,100 |
| 380 | Florence-Muscle Shoals, AL | 84.8 | −15.2% | $84,800 |
| 381 | Shreveport-Bossier City, LA | 84.8 | −15.2% | $84,800 |
| 382 | Hammond, LA | 84.5 | −15.5% | $84,500 |
| 383 | Enid, OK | 84.3 | −15.7% | $84,300 |
| 384 | Texarkana, TX-AR | 84.0 | −16.0% | $84,000 |
| 385 | Dothan, AL | 83.8 | −16.2% | $83,800 |
| 386 | Eagle Pass, TX | 83.8 | −16.2% | $83,800 |
| 387 | Monroe, LA | 83.6 | −16.4% | $83,600 |
Download the full table as CSV (28 KB). Source: U.S. Bureau of Economic Analysis, Regional Price Parities by MSA. Analysis: World Made Visual.
04
Methodology and sources
Data
The price levels come from the U.S. Bureau of Economic Analysis (BEA) table of regional price parities by metropolitan statistical area (table MARPP), released February 19, 2026. We use the 2024 all-items estimates, the most recent year available.
Metro areas follow the delineations in Office of Management and Budget bulletin 23-01, as used by BEA. Each metropolitan statistical area is a group of counties, so a metro label never means city-limit coverage.
Calculations
For two areas in the same year and the same all-items measure:
- Equivalent salary in the comparison area = salary × comparison-area RPP ÷ your-area RPP
- Worth at U.S. average prices = salary × 100 ÷ your-area RPP
- Price difference = comparison-area RPP ÷ your-area RPP − 1
All calculations use BEA's published values at full precision. Results are rounded only for display: salaries to the nearest $100, price levels to one decimal place, and percentages to one decimal place (the headline price gap to a whole percent). The "Salary matching $100,000 at U.S. average prices" column applies the same equivalent-salary formula with the U.S. level (100) as the starting point.
The same code produces the chart, the ranked table, the CSV download, and every number in the findings and analysis.
Coverage
The chart and table include all 387 metro areas in BEA's table. The national level and the nonmetropolitan portion of the country are not metro areas and are not ranked, although the U.S. average can be chosen as a comparison point.
How BEA builds regional price parities
BEA combines consumer price data collected for the Consumer Price Index with rents from the Census Bureau's American Community Survey, and weights them by state-level consumer spending. BEA notes that the consumer price survey was not designed for comparing places, which can make estimates volatile for areas with few observations. Some volatile medical and education items are assigned the national price level. See BEA's methodology document in the sources for details.
Missing values
Metro areas without an all-items RPP for the observation year are excluded from the chart, table, and calculations and listed under coverage. No value is ever treated as zero. For 2024, every metro area in the BEA table has a value.
Sources
- 01U.S. Bureau of Economic Analysis, Regional Price Parities by State and Metro Area. Definitions, current release (February 19, 2026), and next scheduled release.
- 02U.S. Bureau of Economic Analysis, Regional price parities by MSA (table MARPP), downloadable data. The exact file used here; the archive and its checksum are kept with this story's data version.
- 03U.S. Bureau of Economic Analysis, Real Personal Consumption Expenditures by State and Real Personal Income by State, 2024 (news release BEA 26-10). Release that introduced the 2024 regional price parities.
- 04U.S. Bureau of Economic Analysis, Real Personal Consumption Expenditures, Real Personal Income, and Regional Price Parities: Methodology.
Data version
- Regional Price Parities by Metropolitan Statistical Area (MARPP) (U.S. Bureau of Economic Analysis)
- 2024
- February 19, 2026
- November 5, 2026
- 2024-r2026-02-19-2 (sha256 15faaea5fef4…)
- BEA statistics are works of the U.S. Government and are not subject to copyright in the United States (17 U.S.C. § 105). The derived table is offered for reuse with attribution to BEA.
The source's next scheduled release is December 10, 2026. This page will be reviewed when new data is available.
Found an error? Send a correction. See also the site-wide methodology.
05
Questions the data raises
Is this the same as a cost-of-living calculator?
No. A cost-of-living calculator usually estimates a specific household budget. This comparison uses one official measure of average consumer prices for each metro area. It does not include taxes, and it cannot reflect your household's own spending.
Why can't I find my city?
The comparison covers metropolitan statistical areas, which are named after their principal cities but include surrounding counties. Look for the metro area that contains your city. Smaller towns outside any metro area are part of BEA's nonmetropolitan estimate, which had a price level of 88.7 in 2024.
Can I compare this year with earlier years?
Not directly. Each year's regional price parities compare places within that year. They do not measure inflation, so a lower RPP than last year does not mean prices fell.
Can I reuse the data?
Yes. The CSV download contains the values used on this page. BEA's statistics are works of the U.S. Government; please credit the U.S. Bureau of Economic Analysis as the source.
Keep exploring
More visual stories
Money
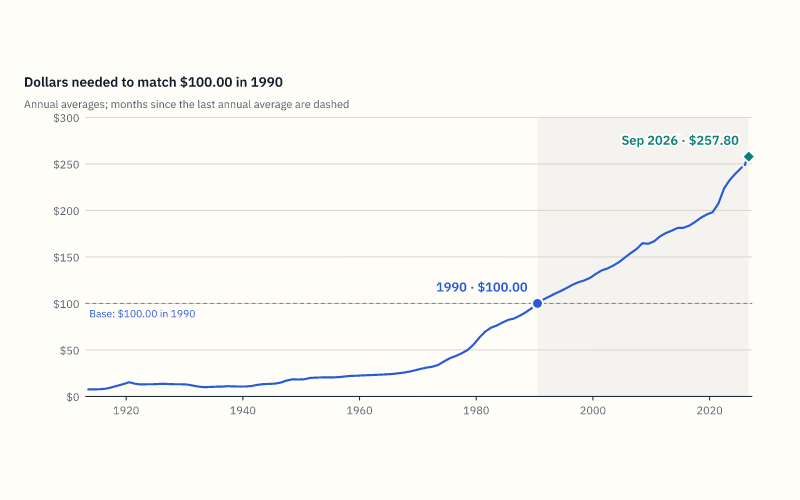
What is a dollar from one year worth in another?
An inflation calculator for U.S. dollars since 1913: enter an amount and two dates to see the equivalent purchasing power, the price change, and how it built up over time.